
Quick overview
Productivity reports show you how work turns into real results.
When powered by workforce analytics, they help you see when employee performance starts to dip, when workloads become too heavy, and when team productivity begins to slip. You no longer rely on assumptions or wait for problems to explode.
Instead, you act early, support your team, and improve performance with confidence.
Are you sure you truly see how your team is performing?
You have productivity reports. You see hours worked and tasks completed. But something still feels unclear. The numbers do not always explain what is really happening behind the work.
Without historical data, you cannot see how performance shifts over time. And without strong productivity tracking, small problems stay hidden until they grow.
That uncertainty starts to affect your decision-making. You hesitate. You second-guess. You wonder if someone is overloaded, disengaged, or close to burnout.
The issue is not a lack of data. It is a lack of visibility.
To improve performance with confidence, you first need to understand what productivity truly means in today’s workplace.
Table of Contents
- What is productivity?
- What is an employee productivity report?
- 7 key performance metrics you should include in a productivity report
- Why manual productivity reports fall short in 2026
- Manual Reporting vs Workforce Analytics Reporting
- How does workforce analytics strengthen productivity reporting?
- How to make a productivity report?
- Why Time Doctor is built for modern productivity reporting
- Final thoughts
- Frequently asked questions (FAQs)
What is productivity?
Productivity is the measurement of output compared to input.
In simple terms, it shows how efficiently time, effort, and resources turn into results. It helps you understand how work creates value.
However, productivity varies across industries. The way you measure it depends on the type of work being done and the functionality required to deliver it.
Productivity = Output ÷ Input
In structured environments, leaders often apply a time study for employees to measure how long tasks should take and to benchmark performance more accurately.
Four (4) types of productivity measures
- Labor productivity – Output produced per hour worked.
- Capital productivity – Output generated by equipment and tools.
- Material productivity – Output produced from raw materials.
- Total factor productivity – Overall efficiency that combines labor, capital, and materials.
These types work well in manufacturing- and operations-heavy industries where output is tangible and easy to count, and where processes are designed to boost productivity through measurable results.
But modern teams do not always work that way.
Measuring employee productivity in modern workplaces
Service-based and knowledge-driven teams measure productivity differently.
A writer is judged by the articles delivered.
A developer is judged by the projects completed.
A support agent is judged by the problems solved.
The work is different, so the measurement must be different too.
Today, productivity focuses less on hours spent and more on results achieved. This reflects the idea behind a results-only work environment (ROWE), where performance is measured by outcomes rather than presence.
Whether your team works remotely, in a hybrid setup, or in the office, what matters most is impact and how clearly you can track progress toward real goals.
Understanding what productivity truly means is the first step. The next step is learning how to see it clearly through structured reporting over a defined time period, so you can measure real progress.
What is an employee productivity report?
A productivity report is a structured summary of how work turns into results over a defined period of time.
It brings together key signals such as time invested, tasks completed, goal progress, performance trends, and sometimes visual summaries in graphs. Instead of isolated numbers, it shows how effort connects to outcomes in a clear, data-driven way.
A strong employee productivity report typically includes:
- Hours worked or time tracked
- Tasks or deliverables completed
- Progress toward goals
- Breaks or idle time
- Performance trends over time
When generated automatically, productivity reports become more accurate and consistent. They reduce manual errors and give you a stronger foundation for performance evaluation.
Without structured reporting, decisions rely on partial information. In project management, someone may look productive because they are always active, while another delivers strong outcomes with less visible activity. Without context, both can be misjudged.
A well-built productivity report turns raw data into clear insight. It helps you assess contributions fairly, spot workload imbalance early, and act before small issues grow into bigger problems.
It does not just show activity.
It shows meaning.
7 key performance metrics you should include in a productivity report
If you want your productivity reports to actually improve performance, basic numbers are not enough.
You need clear, meaningful metrics that show how work impacts team productivity. When your reports connect effort to real results, you stop guessing and start leading with confidence.
That’s when reporting becomes powerful.
1. Output and deliverables
Start with results.
Track completed tasks, closed projects, resolved tickets, or revenue-generating activities. Output tells you whether effort turns into measurable outcomes.
This anchors your productivity report in impact, not just activity.
2. Time allocation and employee time tracking
You need visibility into where time actually goes.
Measure how employees divide their hours between client work, internal projects, meetings, and administrative tasks. Proper employee time tracking reveals whether workload supports priorities or drifts toward low-value work.
Time allocation data supports stronger time management decisions.
3. Focus and productivity patterns
Employee monitoring data should show more than presence. It should highlight productive time, idle time, and application usage patterns.
When you see how focus shifts throughout the day, you can identify workflow friction, excessive context switching, or distraction that reduces productivity analytics accuracy.
This metric strengthens performance conversations without micromanaging.
4. Workload intensity and sustainability
Track overtime trends, weekend work, and unusual activity patterns.
Consistent late-night work may signal dedication. It may also signal burnout risk.
Monitoring workload intensity helps HR leaders detect imbalance early. It helps operations leaders rebalance resources. It helps founders protect sustainable performance.
5. Goal alignment and priority management
Measure whether daily work supports strategic objectives.
When employee activity aligns with defined goals, team performance improves. When effort scatters across low-priority tasks, productivity declines quietly.
Goal alignment links productivity reports to business outcomes, including revenue growth, service quality, and customer satisfaction.
6. Consistency and trend movement
Avoid judging performance based on a single good or bad week.
Trend analysis over a specific time frame, such as weeks or months, provides reliable insight into employee productivity growth, stagnation, or decline.
Trend visibility allows you to act early rather than react late.
7. Efficiency and process signals
Efficiency is the extent to which time translates into results.
When efficiency drops, the issue may not be the employee. It may be workflow design, tool overload, shadow IT, or process bottlenecks.
This is where productivity analytics becomes a performance-optimization tool rather than a monitoring exercise.
Why manual productivity reports fall short in 2026
If you still rely on spreadsheets to build productivity reports, you only see part of the story.
Gallup reports that “global employee engagement fell to 21% in 2024, and disengagement cost the world economy $438 billion in lost productivity.” When employees work without clarity or support, overall productivity suffers quietly.
Static reports do not show how employees work in real time. They miss workload shifts, focus patterns, and early warning signs. That makes it harder to make informed decisions.
When reporting stays manual, you respond after performance declines rather than act early.
In 2026, productivity reports must go beyond spreadsheets and support data-driven decisions that protect performance before it declines.
Manual Reporting vs Workforce Analytics Reporting
Manual productivity reporting focuses on past activity.
Workforce analytics reporting connects real-time signals, historical data, and performance intelligence.
The table below highlights the difference.
| Manual Productivity Reporting | Workforce Analytics Reporting |
| Static spreadsheets | Real-time productivity reports |
| Isolated performance metrics | Connected workforce analytics signals |
| Limited historical data | Trend visibility across a defined time frame |
| Reactive decision-making | Proactive, data-driven decisions |
| Surface-level productivity tracking | Deep employee performance insights |
| Manual consolidation of reports | Automated, centralized reporting |
| Hard to detect burnout early | Early workload and risk detection |
| Numbers without context | Context-driven performance intelligence |
| Occasional review | Continuous productivity audit |
How does workforce analytics strengthen productivity reporting?
Productivity reports tell you what happened.
Workforce analytics helps you understand why it happened and what to do next.
When you connect employee time tracking, workload patterns, focus data, and productivity metrics into a single, clear view, you stop managing in silos. You begin to see how employees work in context.
You no longer rely on assumptions or surface-level activity. You lead with clarity. You coach with evidence. You step in early when workloads become unbalanced or when overall productivity starts to shift.
Instead of reacting to missed deadlines or burnout after the damage is done, you see early signals. You adjust priorities. You redistribute work. You fix process gaps before they affect team performance.
Reporting becomes part of how you lead, not a layer of control. Your team understands what is measured. You use data to coach, not punish. IT keeps visibility simple. Operations stay consistent without extra complexity.
With workforce analytics, the structure behind your data turns into clear insight you can trust and act on.
How to make a productivity report?
A strong employee productivity report does more than track activity. It helps you make informed, data-driven decisions about employee productivity, workloads, and overall productivity.
Here is how you build one that actually works.
1. Start with the leadership question you need answered
Before you pull any data, define your objective.
Are you trying to:
- Improve team performance?
- Detect burnout early?
- Rebalance workloads?
- Compare departments?
- Increase efficiency?
- Improve employee engagement?
Your productivity report must answer a real business question. Otherwise, it becomes documentation without direction.
Clear intent ensures your performance metrics support outcomes, not just reporting.
2. Choose performance metrics that reflect impact
Select KPIs that connect effort to results.
Your employee productivity report should include performance metrics such as:
- Output and deliverables completed
- Employee time tracking and time allocation
- Focus time versus idle time
- Workload intensity and overtime patterns
- Goal alignment and priority management
- Trend movement across weeks or months
Avoid vanity metrics that measure activity without meaning. Strong productivity analytics focuses on outcomes and sustainable performance.
3. Use workforce analytics, not scattered data sources
Instead of pulling data from separate tools and stitching it together manually, workforce analytics centralizes how employees work, how time is spent, and how outcomes are delivered.
Automated, data-driven insights improve accuracy, reduce bias, and give you consistent visibility across remote work, hybrid, and in-the-office teams.
When your reporting system works this way, you stop guessing. You lead with clarity.
4. Organize the report around insight, not just numbers
Do not overwhelm your team with raw data.
Present information in a clear structure:
- What improved
- What declined
- Where workloads shifted
- Where efficiency dropped
- Where productivity increased
Use trends and comparisons to highlight meaningful changes in employee productivity.
Clarity builds trust.
5. Analyze systems before judging individuals
When performance changes, look at processes first.
Is there tool overload?
Is shadow IT affecting workflow?
Are priorities unclear?
Is the workload uneven across teams?
Strong productivity reports help you improve systems before blaming people. That approach protects morale and strengthens employee engagement.
6. Act early and adjust proactively
The purpose of a productivity report is action.
When you see early signals of burnout, inefficiency, or declining overall productivity, respond immediately. Adjust workloads. Clarify goals. Improve processes. Provide support.
Proactive leadership improves team performance and prevents small issues from becoming costly problems.
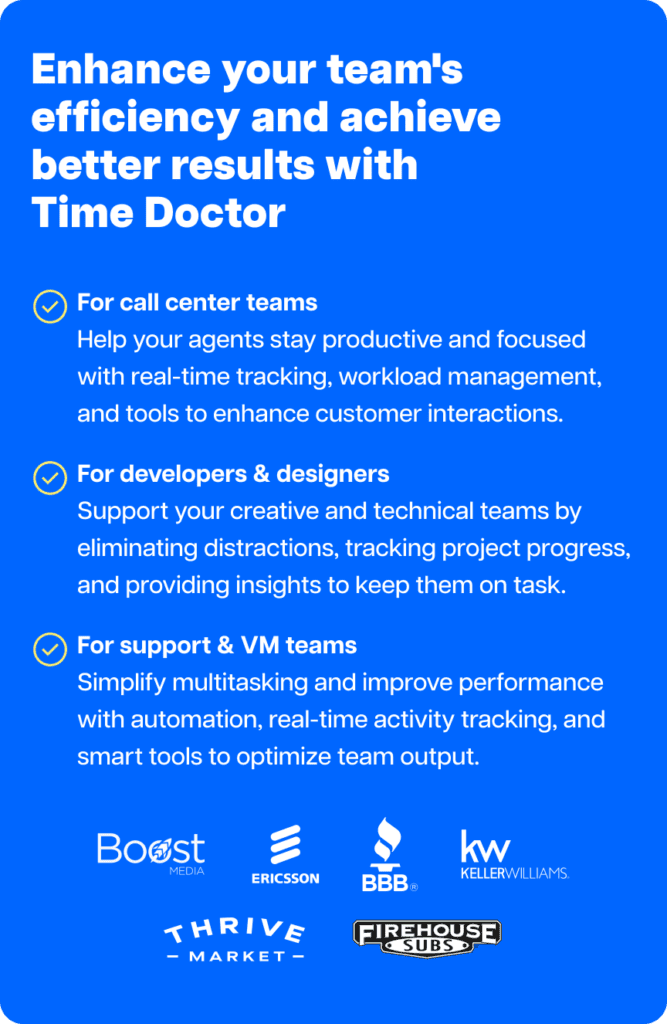
Why Time Doctor is built for modern productivity reporting
Time Doctor is a workforce analytics platform that gives you clear visibility into how work actually happens, so you can lead with trust instead of control.
It turns everyday activity into simple, actionable insight. You see how time is used, where focus drops, which projects demand the most effort, and where workload starts to strain performance.
Instead of relying on scattered reports or surface-level metrics, you gain a clear, continuous view of how your team operates. That clarity helps you act early, support your people, and improve performance without micromanaging.
Here are the capabilities that make Time Doctor a powerful workforce analytics platform for modern productivity reporting:
1. Real-time productivity reports
Modern productivity reporting requires more than hours worked. You need context.
Time Doctor connects employee time tracking, employee monitoring signals, workload patterns, and productivity analytics into one unified reporting system.
Each productivity report helps you answer a leadership question.
A. Activity summary report
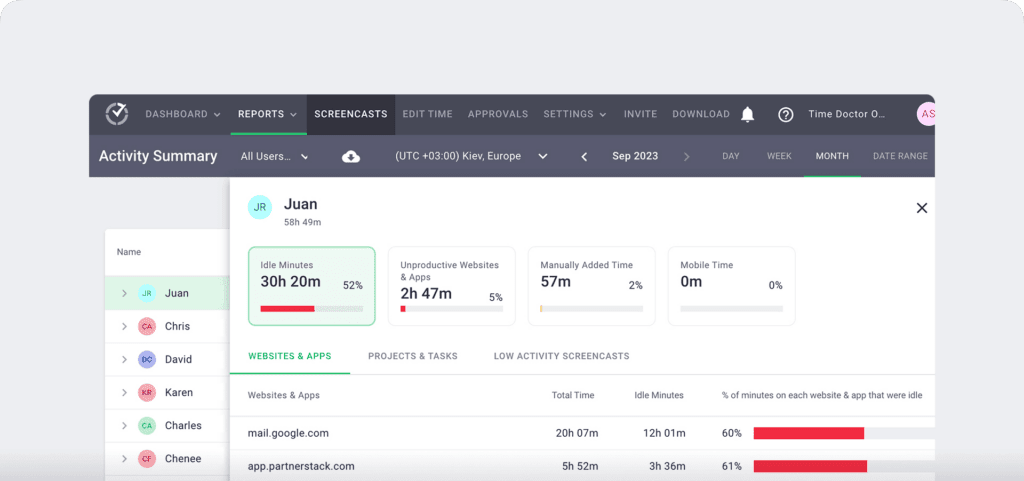
The Activity Summary report gives you a structured overview of how each employee works during a selected period.
It shows:
- Total time tracked
- Idle minutes percentage
- Unproductive websites and apps percentage
- Manually added time percentage
- Mobile time percentage
You can filter by date range, timezone, and user, making it easy to compare team members fairly.
You use this report to:
- Spot workload imbalance before it escalates
- Detect rising idle time that may signal disengagement or burnout
- Identify excessive manual time entries
- Compare performance metrics across similar roles
- Support fact-based employee engagement conversations
Instead of guessing who is overloaded or disengaged, you see structured, data-driven signals.
This is how productivity reports move from surface-level tracking to actionable visibility that protects team performance.
B. Attendance report

The Attendance report connects scheduled shifts with actual tracked time so you can clearly see who showed up and how closely work aligned with expectations.
It shows:
- Date and attendance status (present, late, partially absent, absent)
- Scheduled shift start time
- Actual start time
- Shift length
- Expected hours
- Actual hours tracked
You can filter by users with shifts, late or absent status, and selected date ranges to focus on what matters.
You use this report to:
- Identify patterns of lateness or absence
- Compare scheduled hours with actual tracked time
- Improve payroll and attendance accuracy
- Strengthen accountability without constant check-ins
- Support compliance and workforce planning
Instead of relying on assumptions about attendance, you see structured, time-aligned data that connects scheduling with real work patterns.
C. Hours tracked report
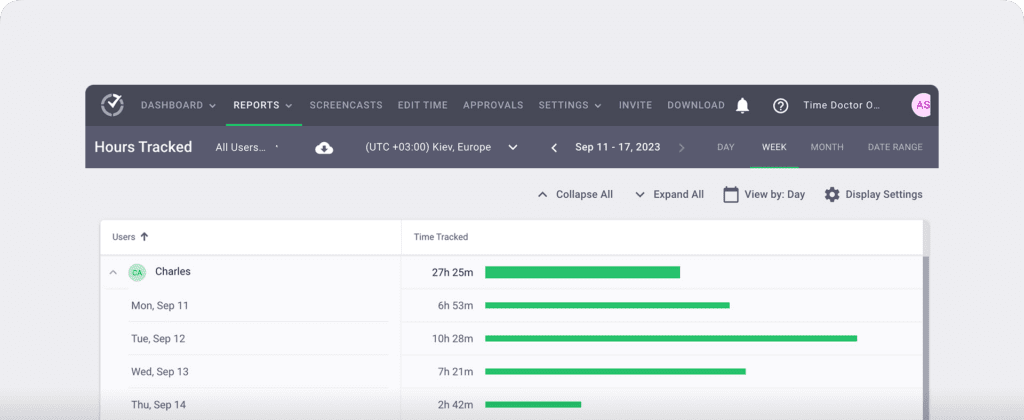
The Hours Tracked report gives you a clear breakdown of total time tracked for each employee within a selected period.
It shows:
- Total hours tracked per user
- Computer time
- Manual time entries
- Mobile time
- Break time
- Paid leave time
You can switch between day, week, month, or a custom date range. You can also adjust by timezone and export data when needed.
You use this report to:
- Validate employee time tracking accuracy
- Separate productive time from leave and breaks
- Identify overtime or underutilization
- Support payroll and attendance alignment
- Improve workforce planning across remote, hybrid, and in-office teams
Instead of relying on scattered timesheets, you see structured, categorized time data in one place.
D. Projects & tasks report

The Projects & Tasks report shows total time spent on each project and each task, broken down by user.
This report is available when project and task tracking is enabled.
It shows:
- Total time tracked per project
- Total time tracked per task
- Individual time contribution per user
- Project hierarchy with expandable task breakdown
- Time tracked within a selected date range
You can switch between day, week, month, or a custom range and adjust by timezone.
You use this report to:
- Measure project delivery pace and efficiency
- Identify tasks that consume disproportionate time
- Detect scope creep before it affects profitability
- Compare contribution levels within similar roles
- Improve workload balance across client and internal projects
Instead of only seeing total hours worked, you see where effort is invested and how it connects to outcomes.
E. Timeline report

The Timeline report shows how employees work throughout the day and week in chronological order.
It gives you a visual breakdown of start times, end times, activity blocks, breaks, and working status.
It shows:
- Start and end time for each user
- Total time worked
- Computer time, manual time, mobile time, break time, and leave time
- Activity blocks displayed across the day
- Working status such as online, on break, or last tracked
You can switch between:
- Day view, which displays detailed activity blocks and exact time segments
- Week view, which summarizes tracked hours per day while allowing deeper drill-down
You use this report to:
- Detect irregular work patterns or gaps in activity
- Identify early signs of burnout or overwork
- Understand how work hours are distributed throughout the day
- Verify attendance consistency without constant check-ins
- Improve time management and workload balance
Instead of relying on totals alone, you see how work unfolds in real time.
F. Web & app usage report
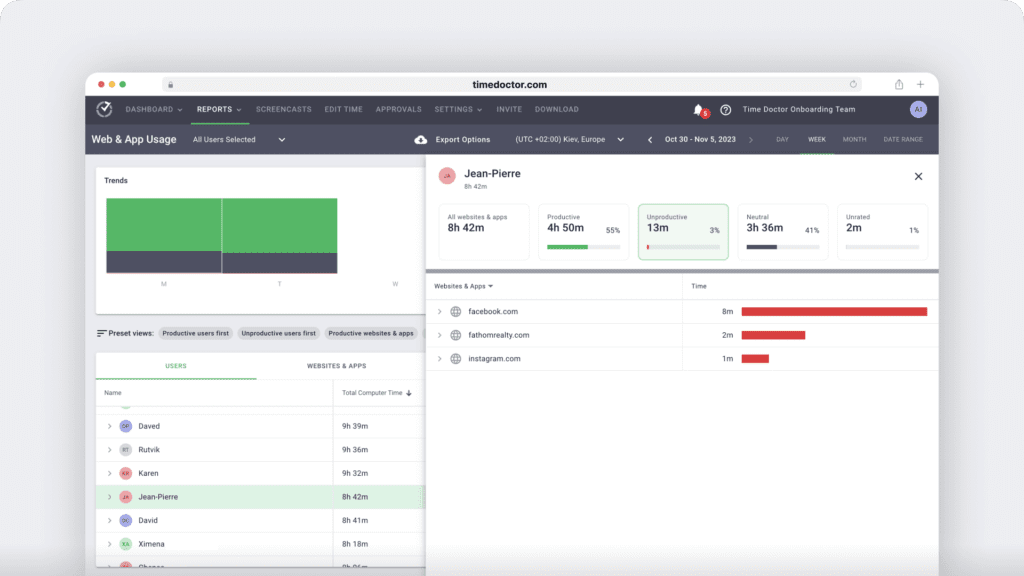
The Web & App Usage report shows how time is spent across websites and applications during work hours, and can include configurable screenshots based on your privacy settings.
It gives you a categorized view of digital activity based on your privacy settings and productivity ratings.
It shows:
- Total time spent on websites and apps
- Productive, unproductive, neutral, and unrated time
- App and website breakdown per user
- Usage trends over selected periods
- Detailed side panel insights per row
You can filter by user, date range, and timezone, and adjust productivity classifications to reflect your organization’s workflow.
You use this report to:
- Understand how employees work in digital environments
- Identify tool overload or shadow IT risks
- Detect excessive time on low-value platforms
- Improve focus and workflow efficiency
- Support data-driven productivity analytics decisions
Instead of assuming how time is spent, you see structured usage data tied directly to employee productivity.
This strengthens productivity reporting by connecting time tracking with real application behavior, while still respecting configured privacy controls.
G. Internet connectivity report
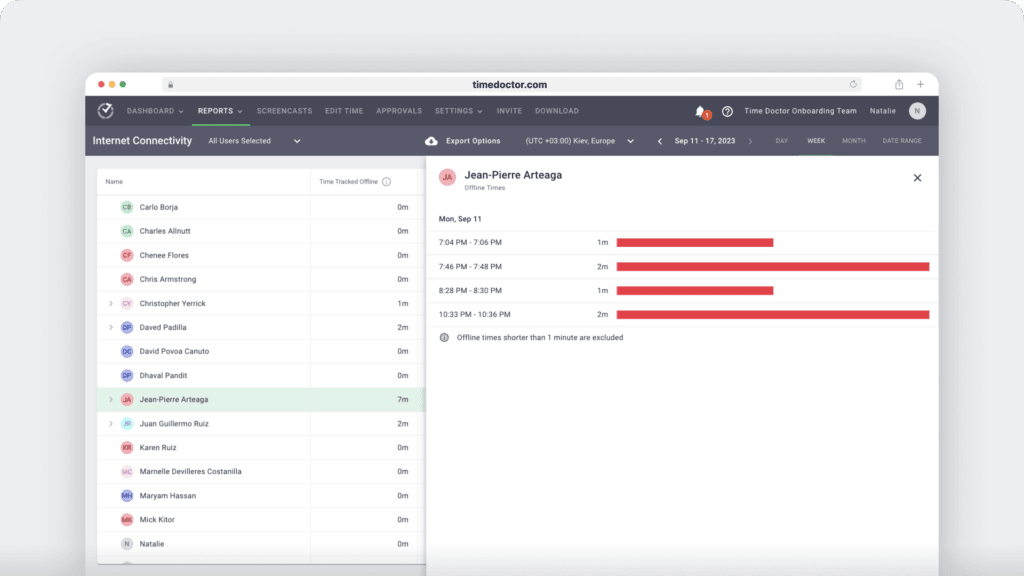
The Internet Connectivity report shows how much tracked time was spent offline during a selected period.
It helps you understand when work continues without an active internet connection and how that affects overall tracked time.
It shows:
- Offline (non-internet) time per user
- Percentage of total tracked time spent offline
- Time blocks when connectivity was lost
- Date-based filtering by day, week, month, or custom range
You can review offline patterns per employee and export the data when needed.
You use this report to:
- Verify time tracking accuracy in remote environments
- Identify recurring connectivity disruptions
- Distinguish true inactivity from network interruptions
- Support fair payroll and attendance validation
- Maintain transparency in distributed workforce setups
Instead of assuming gaps in activity mean disengagement, you see whether internet instability played a role.
This strengthens productivity reporting by adding context to time tracking data, especially for remote and hybrid teams where connectivity can affect logged activity.
H. Custom export report

The Custom Export report lets you combine data from multiple productivity reports into a single structured export.
Instead of downloading reports one by one, you select exactly the fields you need and generate one consolidated file.
It allows you to export:
- Time tracked and manual time
- Productive, unproductive, and neutral time
- Idle minutes and idle seconds
- Break time and unusual time
- User details such as name, email, and employee ID
- Time data in hours and minutes, decimal, or digital format
- Reports in CSV, Excel (XLS), or PDF format
You can also override time zones to align distributed workforce data into a consistent reporting standard.
You use this report to:
- Prepare payroll and attendance documentation
- Share productivity reports with finance or compliance teams
- Support audits in healthcare, banking, and regulated environments
- Consolidate employee monitoring and employee time tracking data
- Deliver structured productivity analytics to leadership
Instead of manually merging spreadsheets, you streamline reporting by generating clean, structured exports in minutes.
This turns productivity reporting into a seamless operational workflow, not an administrative burden.

2. Unified focus and workforce intelligence
Modern productivity reporting requires more than static dashboards. It requires connected intelligence.
Time Doctor strengthens your productivity reports by combining workforce analytics, employee time tracking, employee monitoring signals, and productivity analytics into one unified system. Instead of isolated data points, you gain structured visibility into how work actually happens across your distributed workforce.
This strengthens productivity reporting by helping you:
- Connect employee time tracking with workload patterns and output
- Detect unusual activity patterns before they affect team performance
- Identify burnout risk through workload intensity and focus shifts
- Use Benchmarks AI to compare performance trends objectively
- Monitor attendance and payroll alignment without manual reconciliation
- Surface meeting insight to understand collaboration load
- Track software cost insight and tool usage efficiency
- Maintain visibility across remote, hybrid, and in-office teams
- Protect privacy through configurable screen monitoring and blur controls
- Centralize reporting through secure integrations with your existing tools
Instead of relying on disconnected spreadsheets or reactive summaries, your productivity reports become continuous, data-driven decision systems.
You understand impact.
You protect performance before it declines.
Final thoughts
Productivity reports are not just documents. They shape how you lead.
When your reports only show hours and tasks, you miss the real story. You miss shifting workloads. You miss early burnout signals. You miss small drops in team performance that turn into bigger problems later.
But when your productivity reports are structured, automated, and data-driven, everything becomes clearer.
Because you see how employees work, see where support is needed, and what improves overall productivity.
You stop reacting late, and you start leading with confidence.
So, if you had full visibility into employee productivity, how differently would you manage your team?
If you are ready to turn productivity reports into real performance insight, view a demo and see how modern workforce analytics strengthens every employee productivity report you create.
Frequently asked questions (FAQs)
A productivity report is a structured summary that shows how work turns into results over a specific period. It combines workforce analytics, performance trends, workload data, and goal progress to help you clearly understand employee productivity.
With Time Doctor, productivity reports go beyond hours worked. They connect activity, workload patterns, and outcomes so you can measure performance accurately and act early.
A Time Doctor productivity report includes:
1. Workforce analytics that show workload distribution and performance trends
2. Time tracked across projects, tasks, and attendance records
3. Focus, idle time, and unusual activity signals
4. Web and app usage insights tied to employee productivity
5. Overtime, leave, and shift alignment data
Instead of scattered spreadsheets, Time Doctor centralises this data into structured, data-driven reports that help you measure and improve team performance with confidence.
Productivity reports improve team performance by turning raw data into insight.
They help you:
1. Identify workload imbalance
2. Detect early burnout risk
3. Align daily work with strategic goals
4. Spot efficiency gaps in processes
With Time Doctor, you move from reactive management to proactive leadership based on real performance signals.
Businesses need productivity reports to make informed, data-driven decisions about efficiency, engagement, and performance.
With Time Doctor, you gain continuous visibility into how work happens across remote, hybrid, and in-office teams, helping you protect productivity and prevent costly performance declines.
Workforce analytics is the practice of analysing work patterns, workload trends, performance signals, and productivity data to understand how work truly happens.
Unlike basic time tracking, workforce analytics connects multiple data points into one clear view.
Time Doctor strengthens productivity reports by:
1. Detecting unusual activity and workload strain
2. Measuring performance trends over time
3. Providing Benchmarks AI comparisons
4. Supporting payroll, attendance, and compliance accuracy
This turns productivity reporting into a strategic decision system, not just a tracking exercise.
Time Doctor offers flexible pricing based on team size and feature needs. Plans scale from core productivity reporting to advanced workforce analytics and Benchmarks AI. You can review current pricing to choose the visibility level that best fits your organization.


Liam Martin is a serial entrepreneur, co-founder of Time Doctor, Staff.com, and the Running Remote Conference, and author of the Wall Street Journal bestseller, “Running Remote.” He advocates for remote work and helps businesses optimize their remote teams.