Quick overview
Manual reporting slows operations because it shows yesterday’s work, not what’s happening now. Automated data reporting replaces spreadsheets and one-off reports with continuous, system-driven visibility that supports real-time, data-driven decisions.
If your reporting feels late, fragmented, or unreliable, this article shows how to move from manual reporting to automated, insight-driven operations.
You make important decisions every week. But how clearly does your data analysis reflect what’s actually happening?
Manual reporting creates a quiet but stressful gap between work and decisions. You pull information from spreadsheets, your CRM, workforce systems, and other disconnected data sources, then spend hours rebuilding reports in a different format instead of using a more time-saving approach.
By the time everything is compiled, reality has already shifted. Accurate forecasts feel shaky. Real-world use cases become harder to defend. And without proper data integration, even a small mistake can distort the bigger picture.
That uncertainty builds pressure. You sense problems forming, but the reports show them too late. That is when automated data reporting stops being a nice-to-have and becomes critical.
Table of Contents
- What is automated data reporting?
- How does automated reporting work?
- What is the difference between manual reporting and automated reporting?
- How missing automated reporting affects different industries
- How operations leaders use automated reporting responsibly
- What types of reports can be automated?
- What role do reporting and business intelligence tools play in automated data reporting?
- How does workforce analytics change automated reporting outcomes?
- Final thoughts
- Frequently asked questions (FAQs)
What is automated data reporting?
Automated data reporting means your reports update as work happens, so you do not have to rebuild them by hand. Instead of chasing spreadsheets every week, report automation keeps everything running in the background.
Modern reporting systems pull information directly from your tools using APIs, so data flows automatically instead of through manual exports and copy-paste work. That alone removes hours of time-consuming effort.
The result is simple but powerful. You streamline reporting, reduce stress, and optimize decisions while work is still in motion, not after problems have already surfaced.
How does automated reporting work?
Instead of pulling data after work is finished, report updates as work moves through your operations.
At a high level, the automated reporting process follows a simple, repeatable flow that mirrors how work actually happens.
Data capture
As work progresses, systems automatically capture key work signals. This includes time spent on tasks, progress across projects, activity inside tools and apps, and workload patterns.
You do not ask teams to submit extra updates. The reporting reflects real work, not manual inputs.
Data standardization
Captured data is organized and standardized to enable consistent comparison. This step removes common friction caused by spreadsheet mismatches, disconnected CRM data, or conflicting reports across systems.
You see a consistent view rather than reconciling multiple sources.
Pattern detection
Once the data is consistent, reporting highlights patterns through AI-powered analysis. You can see where time concentrates, where work slows down, how workloads shift, and which activities repeat. This moves data reporting beyond raw numbers toward actionable signals.
Report generation and visualization
Those patterns feed directly into reporting and data visualization that update automatically. Instead of static snapshots, you get views that reflect current operations. Trends become easier to spot, and changes make sense without extra explanation.
The real difference is timing. That shift enables reporting that supports better real-time decision-making, rather than explaining issues after they have already affected delivery, capacity, or productivity.
What is the difference between manual reporting and automated reporting?
The difference between manual reporting and automated reporting is bigger than efficiency. It changes how you lead.
Modern reporting software helps you see problems sooner, decide with more confidence, and spend less time wrestling with numbers.
Here’s what that shift looks like in real day-to-day leadership.
Manual reporting vs automated reporting: what changes for leaders
| What changes | Manual reporting | Automated data reporting |
| Timeliness | Reports reflect past work and arrive days or weeks later. | Reports update as work happens, keeping visibility current. |
| Accuracy | Datasets often conflict across spreadsheets, systems, and exports. | Data stays consistent because reporting follows the same rules every time. |
| Decision speed | You wait for reports before acting, which slows decisions. | You act faster because reporting reflects what’s happening now. |
| Leadership confidence | You second-guess decisions because the data feels incomplete. | You trust decisions because reporting shows a clearer picture of real work. |
| Operational waste | Hours go into pulling data, cleaning spreadsheets, and reconciling numbers. | Manual effort drops because reports generate automatically. |
| Visibility into work | You see outcomes after issues escalate. | You see patterns early, before problems affect delivery. |
| Scalability | Reporting breaks down as teams and workflows grow. | Reporting scales as operations become more complex. |
Manual reporting explains what already happened. Automated data reporting helps you understand what is happening, while you still have time to respond.
That shift changes how you lead. You make decisions with clearer visibility, stronger confidence, and less operational friction.
How missing automated reporting affects different industries
When automated reporting is missing, the impact depends on how your organization delivers work.
In every industry, risk manifests differently. However, the outcome is the same: missed warning signs, preventable rework, and decisions made too late to avoid damage.
Here’s how that gap plays out across different operational environments.
Healthcare organizations
In healthcare, delayed reporting increases both operational and human risk. Workload imbalance, overtime patterns, and sustained pressure remain hidden until staff exhaustion becomes visible. Leaders respond to burnout rather than prevent it, increasing turnover risk and placing additional strain on already limited resources.
Technology companies
Without automated reporting, leaders lack early signals when priorities shift or workloads become unbalanced. Teams appear busy, but delivery slows. Burnout risk builds quietly while reporting focuses on outputs instead of patterns. By the time issues surface in reports, velocity and morale are already affected.
Agencies
Agencies face direct financial risk when reporting is manual. Scope creep and uneven effort stay hidden until margins shrink. Leaders realize projects are over-consuming time only after budgets are exceeded, forcing difficult client conversations and internal pressure that could have been avoided with earlier visibility.
CX and contact centers
Without automated reporting, leaders rely on delayed data to manage real-time demand. Staffing decisions are based on yesterday’s volumes, not current queue pressure. The risk is chronic understaffing during spikes, rising wait times, agent fatigue, and customer dissatisfaction before leadership sees the trend clearly enough to respond.
BPO and KPO operations
In BPO and KPO environments, manual reporting increases delivery risk. Utilization gaps, productivity drift, and missed handoffs surface during client reviews rather than during execution. This exposes leaders to SLA breaches, client escalations, and reactive firefighting instead of controlled course correction.
Staff leasing and workforce outsourcing
When reporting stays manual, visibility into hours, attendance, and workload lags behind reality. The risk manifests as payroll disputes, billing inaccuracies, and compliance exposure. Leaders spend time reconciling data after the fact instead of confidently planning placements and capacity.
How operations leaders use automated reporting responsibly
Responsible leaders use automated reporting like a dashboard, not a security camera. The goal is to see where the road is narrowing, not to watch every move behind the wheel.
As reporting becomes more automated, the way you use it matters more than ever. Gartner predicts that “by 2027, 60% of repetitive data management tasks will be automated”.
That shift puts leadership judgment at the center. Reporting helps you see how work flows, where pressure builds, and where teams need support, so you can guide operations more effectively.
Trust comes from clarity and boundaries. With 144 countries enforcing data privacy laws, responsible leaders define how reporting is used, who can access it, and where visibility ends through clear data governance.
When teams understand the purpose and limits, reporting feels supportive instead of intrusive.
It strengthens leadership, and it gives you visibility without breaking trust.
What types of reports can be automated?
Operations leaders automate reports that help them understand how work actually happens, not just what gets delivered. These reports provide clarity across teams, tools, and work environments, whether people work remotely, in a hybrid model, or in the office.
Here are the types of reports most often automated in modern operations.
Time allocation by project, client, or work type
Automated reporting can show how employee time is distributed across projects, clients, or recurring work. Instead of rebuilding spreadsheets, you see how effort shifts over time, which supports better time management, fairer allocation, and clearer expectations, especially in agencies and technology teams.
Capacity, utilization, and workload balance
Automated capacity and utilization reports show how available time is actually used. You can spot sustained overload, underutilization, or uneven distribution of work across a distributed workforce. This supports healthier planning and more defensible staffing decisions, particularly in healthcare and high-growth environments.
Focus and work-pattern trends
Rather than tracking individual moments, automated reporting highlights patterns in how work time is spent. Over time, you can see how focus changes, where work becomes fragmented, and how meetings or interruptions affect productivity. These insights help explain performance shifts without relying on assumptions, which is especially important during a performance review for remote employees.
Attendance and payroll-ready reporting
Automated attendance reports reflect working hours and consistency without manual reconciliation. This creates a reliable foundation for payroll processes and reduces friction between operations, HR, and finance, especially in environments with strict compliance requirements.
Software and tool usage insights
Automated reporting can reveal how tools are actually used during the workday. Over time, this supports better decisions about integrations, software costs, and tool rationalization, helping leaders reduce waste without disrupting productive workflows.
Meeting and collaboration patterns
Reporting can also surface trends in meeting time and collaboration load. Instead of relying on calendars alone, leaders gain a clearer view of how meetings affect focus and delivery, which helps balance collaboration with deep work.
Automated data reporting brings consistency. Reports update regularly, follow the same structure, and reflect real work, not random snapshots.
Without that consistency, leaders drown in disconnected tools and numbers they don’t fully trust. Manual work creeps back in. Confidence drops.
When reporting truly reflects how work happens, it stops being just another dashboard. It becomes the foundation for workforce analytics and better leadership decisions.
What role do reporting and business intelligence tools play in automated data reporting?
| Tool Type | What It’s Good At | Where It Falls Short for Operations | How It Fits with Workforce Analytics |
| Spreadsheets (Excel, Google Sheets) | Manual tracking, quick calculations, custom report building | Time-consuming updates, version control issues, human error, limited scalability | Often used for manual reporting before automation replaces them |
| Microsoft ecosystems (Power BI, Excel, PowerPoint) | Visualization, KPI dashboards, executive presentations | Depend on clean upstream data and structured models | Can visualize workforce analytics outputs once reporting is automated |
| BI tools (Power BI, Looker, Tableau) | Data visualization, dashboards, trend analysis, stakeholder reporting | Show summarized outputs, not how work actually happens | Sit on top of workforce analytics as presentation layers |
| CRM & analytics platforms (Salesforce, Google Analytics) | Customer data, revenue tracking, marketing metrics | Do not capture operational workflow, effort, or time patterns | Provide business metrics that complement workforce analytics |
| Embedding and dashboard integrations | Sharing dashboards inside internal portals or apps | Still rely on underlying data quality and reporting structure | Useful when workforce analytics feeds automated data into embedded views |
How does workforce analytics change automated reporting outcomes?
Automated data reporting saves time, but speed alone does not create clarity. Reports can update automatically and still miss what really matters if they only show surface numbers.
That is where workforce analytics changes everything.
Instead of relying on summaries stored in data warehouses, workforce analytics connects key metrics to real work activity. You see how time is spent, how tools are used, and where pressure builds before it turns into missed targets or burnout.
Now reporting does more than describe what happened. It helps you make informed decisions while work is still in motion.
That is the difference between having dashboards and having real operational insight.
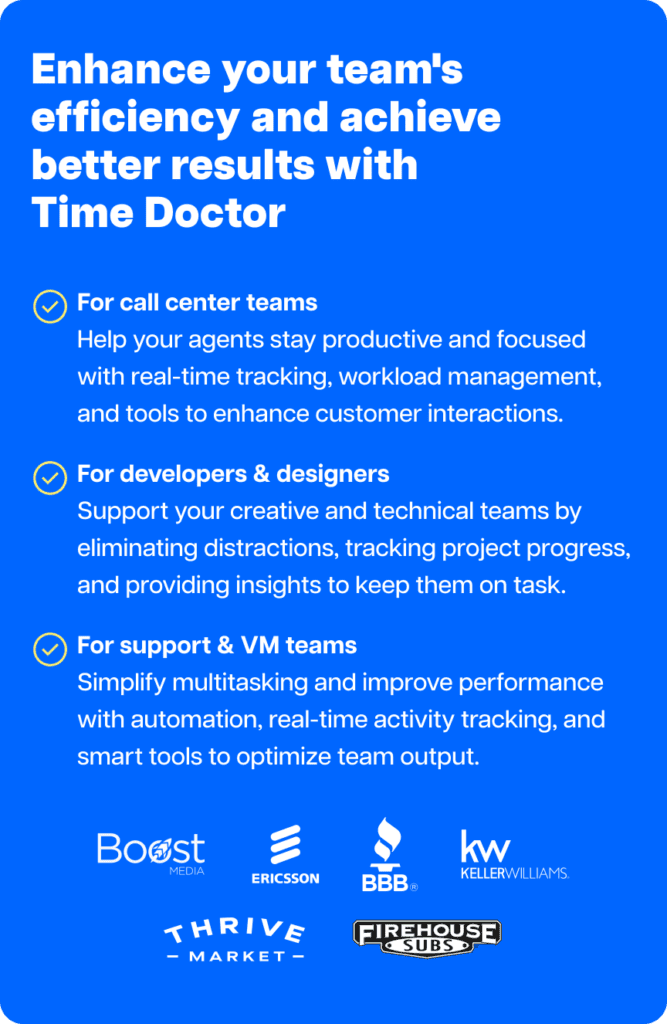
And that is where Time Doctor comes in.
Time Doctor: Best for automated data reporting
Time Doctor brings reporting and analytics functions into one connected system built for operations leaders. It replaces manual reports and time studies with continuous visibility across remote, hybrid, and in-office teams.
Instead of juggling spreadsheets and disconnected tools, you get automated reporting through interactive dashboards that show how work truly flows, so you can lead with clarity instead of guesswork.
Empowered leadership through clearer work data
When reporting reflects real work patterns, you make better decisions with more confidence.
With Time Doctor, your reporting shows:
- How employee time is allocated across projects, clients, and work types
- Where effort aligns with priorities and where it quietly drifts
- Early workload imbalance before it affects performance or retention
Because reporting is based on real work activity and delivered through interactive reports, you coach with context instead of assumptions and step in earlier with confidence.
AI-driven benchmarking highlights patterns in your key performance indicators, while flexible templates adapt to changing reporting needs. That clarity helps you make fair, consistent decisions without micromanaging your team.
Actionable visibility that replaces manual reporting
Automated reporting should give you visibility you can act on, not just faster summaries.
Time Doctor’s workforce analytics provide real-time insight into:
- Productivity patterns and focus shifts across teams
- Meeting and collaboration load that affects deep work
- Software and tool usage that reveals inefficiencies and cost waste
- Attendance and workload trends across a distributed workforce
By continuously reporting updates, you catch problems early instead of reacting after delivery or payroll is affected.
It turns raw data into clear insight through consistent report templates, giving you the scalability your growing team needs without added stress.
Seamless partnership that fits real operations
Automated reporting only works when it fits within your organization’s existing operations.
Time Doctor integrates into your existing workflows using purpose-built connectors so you can:
- Reduce time spent on manual reports and reconciliations
- Support payroll, attendance, and compliance needs with consistent data
- Apply clear boundaries that protect privacy and maintain trust
This matters whether your team is remote, hybrid, or on-site, especially in regulated environments where data security and accuracy shape trust and compliance.
Because reporting runs in the background, data collection happens automatically, so visibility becomes part of everyday work instead of another burden on your team.
Final thoughts
Manual reporting makes leadership harder than it needs to be. You are asked to make decisions today using data that describes yesterday’s work.
When reporting lags behind reality, confidence drops. Issues surface late. Pressure builds quietly. And by the time problems show up in reports, the impact is already felt.
Automated data reporting changes this only when it reflects how work actually happens. When visibility updates as work moves, you stop guessing and start acting earlier, with clarity and control.
So, the real question is whether your reporting helps you lead in the moment or explains problems after the fact.
If you want to see what automated data reporting looks like when it’s built on workforce analytics and designed for real operations leadership, view a demo of Time Doctor and see how teams replace manual reporting with visibility that keeps up with work.
Get a demo to replace manual reporting with real-time workforce insights
Frequently asked questions (FAQs)
Automated data reporting with Time Doctor means your reports update in real time as work happens, without manual effort. As a workforce analytics reporting solution, it captures real work activity and turns it into clear, up-to-date reports.
You get consistent visibility into how time is spent, how work flows, and where pressure builds, without rebuilding spreadsheets or running manual time studies every week.
Time Doctor supports automated data reporting by capturing real work activity and generating reports that update automatically, without manual effort.
Instead of relying on spreadsheets or one-off exports, you get continuous reporting based on:
• Employee time tracking across tasks, projects, and clients
• Workforce analytics that show how work flows, not just final outputs
• Productivity analytics that surface focus patterns and workload trends
• Attendance and payroll-ready data that stays consistent over time
• Meeting and tool usage insights that reveal how work time is actually used
• AI-assisted benchmarks that highlight trends, anomalies, and early risks
• Built-in integrations that keep data flowing from the tools your teams already use
This approach keeps reporting current, standardized, and grounded in real work patterns. As a result, automated data reporting becomes a reliable foundation for workforce analytics, not just another dashboard to maintain.
Many automated reporting tools focus on outputs like completed tasks, closed tickets, or revenue totals. They may show clean graphs, but they often miss how work actually happens.
Time Doctor is different. Its reporting is built on workforce analytics, so you see time spent, work patterns, tool usage, and workload signals in real time. That means clearer visibility into effort and flow, not just results.
Instead of relying on manual inputs or delayed exports, Time Doctor connects reporting directly to real work activity. You get consistent insights that support operational decisions and even inform smarter pricing and capacity planning.
Time Doctor automates reports that help you understand how work actually happens across your teams. Common automated reports include:
• Time allocation by project, client, or task, showing where effort is spent over time
• Capacity and utilization reports, highlighting workload balance across individuals and teams
• Productivity and work-pattern trends, including focus time and shifts in activity
• Attendance and payroll-ready reports, based on actual working time and consistency
• Software, application, and meeting usage insights, revealing which tools support work and where time is lost
Because these reports update automatically as work progresses, you get consistent visibility into real-time data without manual reporting. The focus stays on work patterns and operational flow, with clear access control to ensure the right people see the right information.
Workforce analytics turns automated data reporting into something you can actually use to lead. Instead of relying on manual data extraction or isolated metrics, it connects reporting to how work really happens each day.
With Time Doctor, workforce analytics links time, tools, and work patterns into continuous, self-service visibility. You can see workload pressure, productivity shifts, and early risk signals as they form, not after the fact.
Because reporting updates in real time based on actual work activity, insights stay grounded in reality. You make faster, fairer decisions without chasing reports or rebuilding dashboards.


Liam Martin is a serial entrepreneur, co-founder of Time Doctor, Staff.com, and the Running Remote Conference, and author of the Wall Street Journal bestseller, “Running Remote.” He advocates for remote work and helps businesses optimize their remote teams.