Keeping track of call center statistics and performance metrics is key to improving productivity, profitability, and customer satisfaction.
In this article, we’ll highlight the top 41 call center stats from 2022 that you need to monitor in 2023.
We’ll also cover the 10 metrics you need to track to ensure that your call center operation runs smoothly. We’ll show you how each KPI can affect your service experience and what you need to do to remain productive.
Let’s get started.
Why you need to track call center statistics
Tracking call center statistics is a good way to keep up with changing industry standards.
You can identify customer expectations and structure your services accordingly. It enables your customer service team to keep up with evolving customer needs and deliver great customer service.
Each statistic offers a glimpse into what you could improve.
Plus, regularly paying attention to every relevant call center statistic will ensure you’re always ahead of the curve and your competitors. You’ll be able to future-proof your work processes.
Top 41 call center stats 2022
These customer service statistics highlight how large and small businesses adapt to modern needs. They also give you a good idea of what the future holds for call centers.
A. Call Center customer statistics
Knowing what your customers want helps you satisfy their needs immediately and give them a positive experience.
Here are call center statistics on customer experience and expectations based on Replicant’s 2021 Survey, Hubspot’s 2022 Report, and Salesforce’s 2022 Report:
1. 91% of consumers reported poor customer service in 2021.
2. 88% feel that the experience a company provides is as important as its product or services.
3. 96% of consumers say excellent customer service builds trust.
4. 88% believe trust is more important in periods of change, like adopting new technologies or customer service processes.
5. 94% of customers say that positive service experiences make them more likely to purchase again.
6. 90% of them say that an immediate response is very important when they have a customer service question.
7. 44% of people report being annoyed or irritated when kept on hold for 5 to 15 minutes.
8. 70% of customers found it easier to reach a real person during the pandemic’s beginning than now.
9. 59% of them prefer communicating their questions and issues via live calls.
10. 53% think most customer support interactions are fragmented since they need to interact with executives over multiple channels or calls.
11. 83% of people prefer to speak to just one person to resolve any complex customer issue.
12. 48% of consumers switched brands due to better customer service by the other company.
13. 85% of customer service executives say that customers are more likely to share positive or negative experiences now than in the past.
What do these stats mean?
Almost every customer service and call center statistic above shows that customers have high service standards. They no longer want to settle for a poor customer service experience.
Plus, consumers value convenience and speed, which are better offered by digital channels like chat, email, SMS, social media, and messaging apps. So, call centers could aim to leverage the digital trend to improve customer experience.
Call and contact centers must provide top-notch service facilities to survive in 2023 and build customer loyalty.
B. Statistics on how businesses are improving their call centers
Modern call centers are not what they used to be 20 years ago. Today some customers may prefer engaging with a customer service agent over channels like social media, live chat, and email instead of live calls.
Here are a few findings from HubSpot’s 2022 Report on how businesses are improving their call center workforce management and customer service strategy:
1. 51% of customer care executives feel that their businesses now focus on proactive customer service.
2. 24.5% of customer care executives believe their business prioritizes saving costs, which is a ten-point drop from last year.
3. According to a NewVantage 2022 report, 91% of large companies planned to increase investments in big data analytics and AI. Analytics could further help call centers improve their customer care.
4. 70% of professionals stated their organizations track customer satisfaction and happiness.
5. 65% of customer care professionals say their organization surveys customers to understand their preferences and experiences.
6. 55% of professionals in exponential growth companies say they survey customers after every interaction.
7. 60% of executives say their company leverages review sites and social media to gather customer feedback.
8. 36% of customer care professionals mention their organizations track NPS score (Net Promoter Score) to analyze customer satisfaction. This increased from 17% in 2019.
9. About 35% of professionals claim their companies maintain formal customer advocacy programs.
10. According to GetFeedback’s 2022 Report, 73% of professionals have increased their efforts to deliver personalized customer experiences since COVID-19.
11. 95% of customer service leaders believe that a Customer Relationship Management (CRM) platform effectively increases productivity.
12. 53% of customer service teams used a help desk system in 2021, which increased from 42% in 2020.
13. Other useful call center solutions in 2021 included:
- A knowledge base (used by 52%).
- A shared email alias (used by 47%), which is a way to receive emails sent to different IDs in one place.
14. 50% of customer care executives say they engage in learning at least a few times a month.
15. 54% of professionals believe peer relationships are the best method for upskilling.
16. 45% of customer service professionals believe that creating a great customer experience is the main priority for their department. Customer success comes second with 75%, retaining customers third with 35%, and customer engagement fourth with 33%.
What do these stats mean?
The focus of call centers has shifted from just revenue and agent productivity to customer satisfaction. Businesses now rely on customer feedback to improve their performance and build customer loyalty. They access call center analytics to accurately assess customer data and uncover valuable insights about their needs and preferences.
Businesses are also investing in software and training to improve customer experiences. The statistics show that collaborative software helps give agents an edge to better serve customers during interactions and queries.
C. Statistics on the future of call centers
Call center software is changing the way we deal with customer interactions.
A modern cloud-based call and contact center has software like speech recognition, machine learning, and live chat to optimize customer queries.
Here are some statistics from Replicant’s 2021 Survey, Salesforce’s 2022 Report, Statista, Dialpad’s 2022 Report, and Accenture’s 2021 Study on what to expect in the future.
1. Nearly 80% of consumers say they would speak to a machine to avoid long wait times.
2. 57% of consumers would rather speak with a conversational machine, even if the wait time were only five minutes.
3. 28% of American consumers wouldn’t mind interacting with an automated system instead of a person when making a customer service request.
4. 56% percent of customers expect interactions to be personalized.
5. 79% of customers in the United States and 74% of global customers have used a self-service support portal for customer service.
6. 77.79% of people feel optimistic about AI for customer service interactions.
7. 66% of customer service executives feel that AI will positively impact their business performance.
8. The global conversational AI market will grow from USD 6.18 billion in 2021 to USD 13.9 billion by 2025.
Here are a few more call center statistics from CustomerThink and 8×8:
1. Call and contact center leaders anticipate a long-term hybrid work environment, with about 53% of agents working in an office and 47% working remotely. 64% of agents primarily operated remotely in 2021.
2. Omnichannel self-service is set to become a priority for the future of call centers. 40% of organizations have increased their use of self-service IVR software.
3. Supporting the trend for increased usage of digital channels, video calls have seen a 48% increase since the pandemic. However, voice communication has also increased by 41%.
4. 49% of call and contact centers now consider employee satisfaction as a top five KPI after customer satisfaction, response time, and quality assurance.
What do these stats mean?
These stats forecast that the call center industry will expand beyond inbound and outbound calls. More than half of all customer interaction will happen through non-voice channels, with agents potentially working remotely. So, telemarketing call centers will have to modify their service strategy accordingly.
The statistic on using a machine could indicate the benefits of using an IVR system (Interactive Voice Response) or AI.
AI will help you improve agent performance through intelligent call routing and improved call analytics. Social media and analytics will also play significant roles in the future to help consumers resolve issues quickly and fix bad customer service experiences.
Companies are also considering hybrid and outsourced call center operations to minimize company costs and maximize agent efficiency.
With changing call center trends, voice interactions aren’t as dominant as they used to be. The customer satisfaction statistic indicates telemarketing call centers should also explore channels like social media, live chat, and emails to boost customer engagement. There will be an increase in the usage of digital channels, paving the way for an omnichannel customer service strategy.
The bottom line is that integrating new channels and adapting practices to meet customer and employee preferences will be the key focus of call centers.
Now, let’s explore why it’s beneficial to track call center metrics.
Why you need to measure call center metrics
Performance metrics, like call abandonment rate, service level, average time in queue, etc., help you assess the performance of your outbound and inbound call center. You need to know how profitable your calls are and how successful those interactions are.
A call center supervisor must find the best solution to:
- Reduce costs.
- Improve customer retention.
- Increase conversion rates.
- Measure agent productivity.
Treat each of these call center metrics as a KPI (Key Performance Indicator) and use them to gauge how successful your call center management is.
The best call center metrics to track today
Here are the best call center metrics that you should be tracking to measure agent productivity and improve customer service quality:
1. Average call abandonment rate
You want to provide great customer support, but how is that possible when your customers disconnect before reaching an agent?
As per the 2021 Talkdesk Global Contact Center KPI Benchmarking Report, the average incoming call abandon rate of global call centers was 6.44%.
Call abandonment usually happens when customers are put on hold for too long, which is common during peak hour. When you increase the hold time of the customer, you make them feel unappreciated and increase the chances of an abandoned call. In other words, you’re delivering a poor customer experience.
It causes your customer to lose faith in your organization and costs your service representatives the opportunity to help them. A long hold time and a higher number of abandoned calls will also harm your customer retention rates.
That’s why the average abandoned call rate is one of the most critical call center performance metrics to determine agent performance.
2. Percentage of blocked calls
A blocked incoming call occurs when your caller (customer) gets a busy tone. More blocked calls mean more missed calls and fewer opportunities for your customer service representative to help customers.
But why does this occur?
Usually, it’s because you have an inadequate number of agents (poor staffing) who cannot manage the call volume. Alternatively, your agents could be spending too much time on each phone call.
So, as a call center manager, you may need to increase the total number of service representatives per shift. You can also set guidelines for talk time to ensure that your agents are efficient. Its implementation will help reduce the number of calls being turned down and increase customer retention.
3. Average time in queue
Average time in queue refers to your customer’s wait time before reaching an agent. This call center metric is directly related to your customer experience and customer retention rates. Long wait times usually result in poor customer engagement.
According to Freshworks’ Deconstructing Delight 2021 Report, 22% of customers feel wait times are too long, and 52% expect a quick resolution.
So, you may consider telling your call team to improve their time management to reduce your customers’ wait time and abandon rate.
Alternatively, consider investing in a callback system so that your customers will not have to waste their time in the queue. Additionally, a workforce management system can also help you assess whether agents are too busy to handle your incoming call volume.
4. Service level
The service level of an outbound or inbound call center is the answered call percentage within a certain period. This key performance indicator determines if a particular customer service representative deals with calls quickly. It’s also essential because customers appreciate an immediate response time.
Most contact centers set this target service level as a ratio. For example, an 80/30 call center service level means your agents try to answer 80% of all calls within 30 seconds.
Download a sample call center service level agreement template and customize it to your business needs.
5. Average speed of answer (ASA)
This is an important call center KPI and performance metric that you can use to analyze the productivity of your call center agent. The faster your response time, the better the customer journey.
The shorter your ASA, the higher your service level.
If your average speed of answer is high, your service representatives need to improve their efficiency in receiving customer calls. Once done, you can improve your answered call percentage.
6. Average handle time (AHT)
Average Handle Time is a vital call center metric to measure call center productivity. It’s the average talk time an agent spends on each customer call (inbound call or outbound call).
An agent’s average handling time is usually compared to a pre-set handle time benchmark. If an agent continuously exceeds the total call time benchmark, they may be struggling to respond to customer requests.
On the other hand, if an agent continuously falls short of the talk time range, he may be rushing through the customer call. Both situations deserve attention to ensure that your customer retention rates don’t drop and you don’t deliver a poor customer experience.
Explore everything about average handle time and seven ways to streamline it.
7. Average after-call work time
Often a call center agent is left with after-call work, like writing call notes, updating data in a CRM, or sending an email to the caller.
The call center manager must set a specific time for agents to work on this relevant post-call paperwork. However, if your agents spend too long on this, they could waste potential time spent on customer calls.
Using a time-tracking tool like Time Doctor will help here. Your employees can easily log the time they spend on after-call work to ensure they’re not exceeding the guidelines. All they have to do is start the timer when they start work and pause it when they’re done.
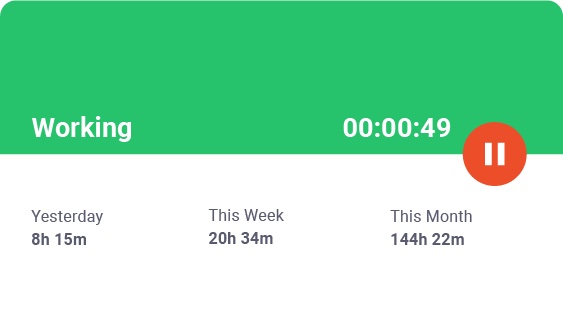
As Time Doctor is accurate to the second, you’ll have a real-time record of how long each agent spends on post-call work.
It allows agents to track this performance metric and learn where they can improve right from the app dashboard. This, in turn, can increase employee engagement in your call center and help you generate more revenue.
8. First Call Resolution (FCR)
First Call Resolution (also called First Contact Resolution), or the FCR rate, is one of the most vital KPIs to assess your call center performance. It measures if an agent resolved a customer issue the first time they reached out or if they had to call back repeatedly.
Nearly 90% of customers agree that faster issue resolution (or a higher FCR rate) is the most important aspect of good customer service.
This call and contact center metric also measures if the incoming phone call was transferred or handed to a supervisor for resolution. Keeping First Contact Resolution (FCR) rates high is crucial to ensure higher customer satisfaction and lowered costs.
9. Occupancy rate
Occupancy rate refers to the amount of time your agents are involved in work-related activities. If an agent is engaged in work activity for 7 hours in an 8-hour workday, their occupancy rate is 7/8.
A low occupancy rate indicates an inefficient workflow. Keeping a check on agents’ schedule adherence can help maintain efficient job processes.
It also helps you understand how much time they dedicate to an inbound call or outbound call, or any other call center operation.
You can use Time Doctor’s reports to keep a check on where your employees are spending their time:
1. Hours tracked report
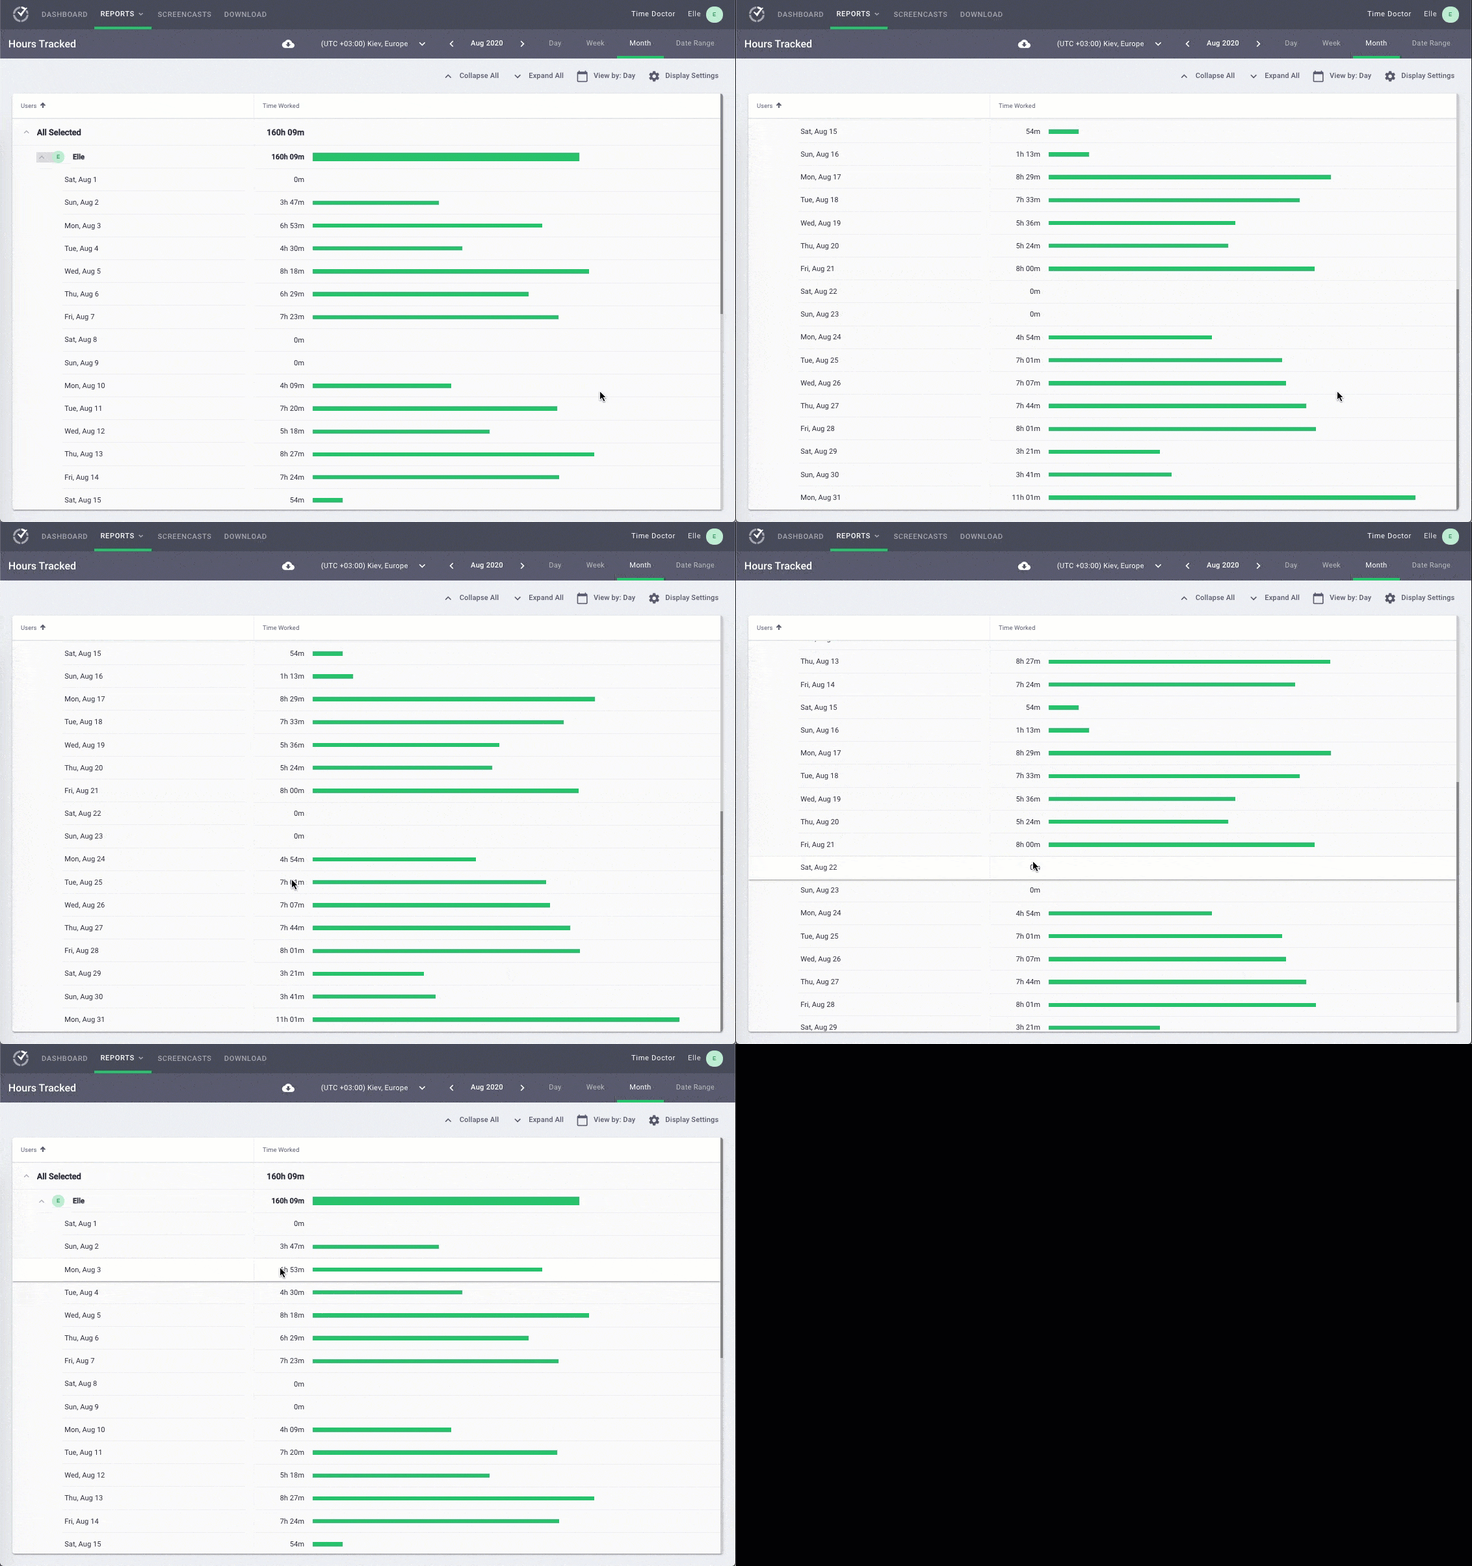
What it shows:
The total hours worked by your agents per day over a given time frame.
How to use it:
It’s a good way to check if your employees are putting in the recommended total number of hours daily, weekly, or monthly.
2. Timeline report

What it shows:
A breakdown of all the tasks your agents worked on over a given period. You can see which tasks were worked on and how much time was spent on them. In other words, you can easily track the agent’s productivity.
How to use it:
This report can quickly identify how much time each employee spends on different tasks, such as after-call work.
3. Web and app usage report
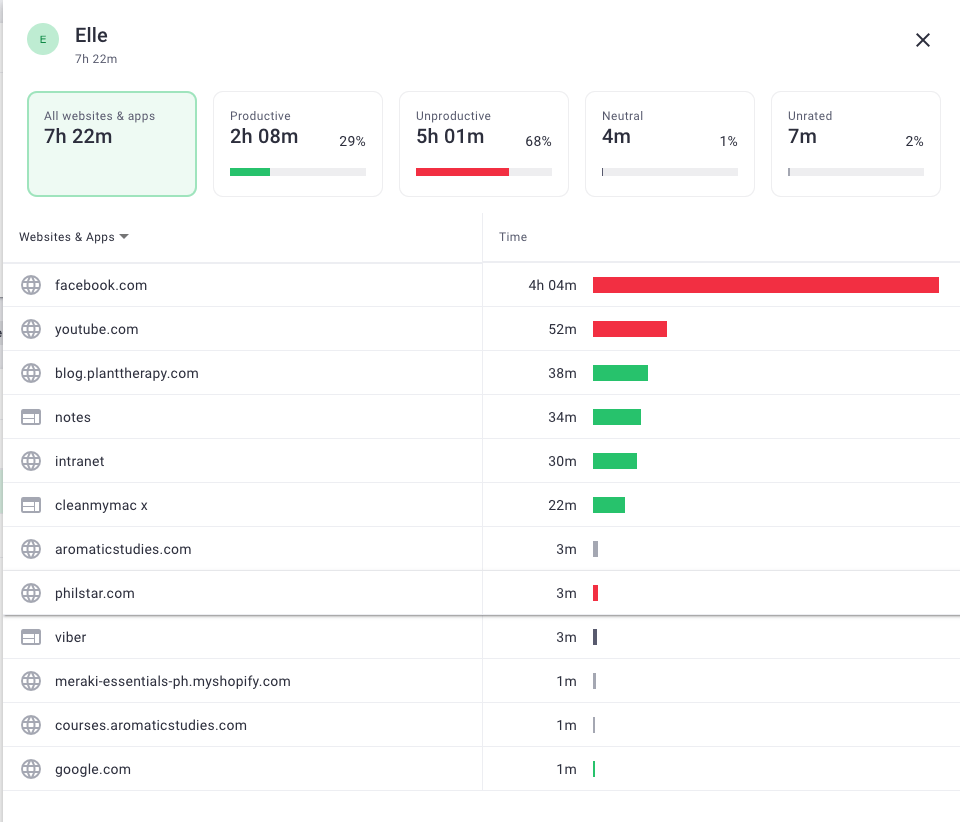
What it shows:
This report breaks down every site and app accessed by an employee during work hours. It also logs how much time they spend on each site or app.
How to use it:
Use this report to verify if your employees only spend time on work-related sites and apps. It makes it easy to identify if an employee is accessing unproductive sites like social media (Twitter, Facebook, etc.) during work hours.
4. Activity summary report
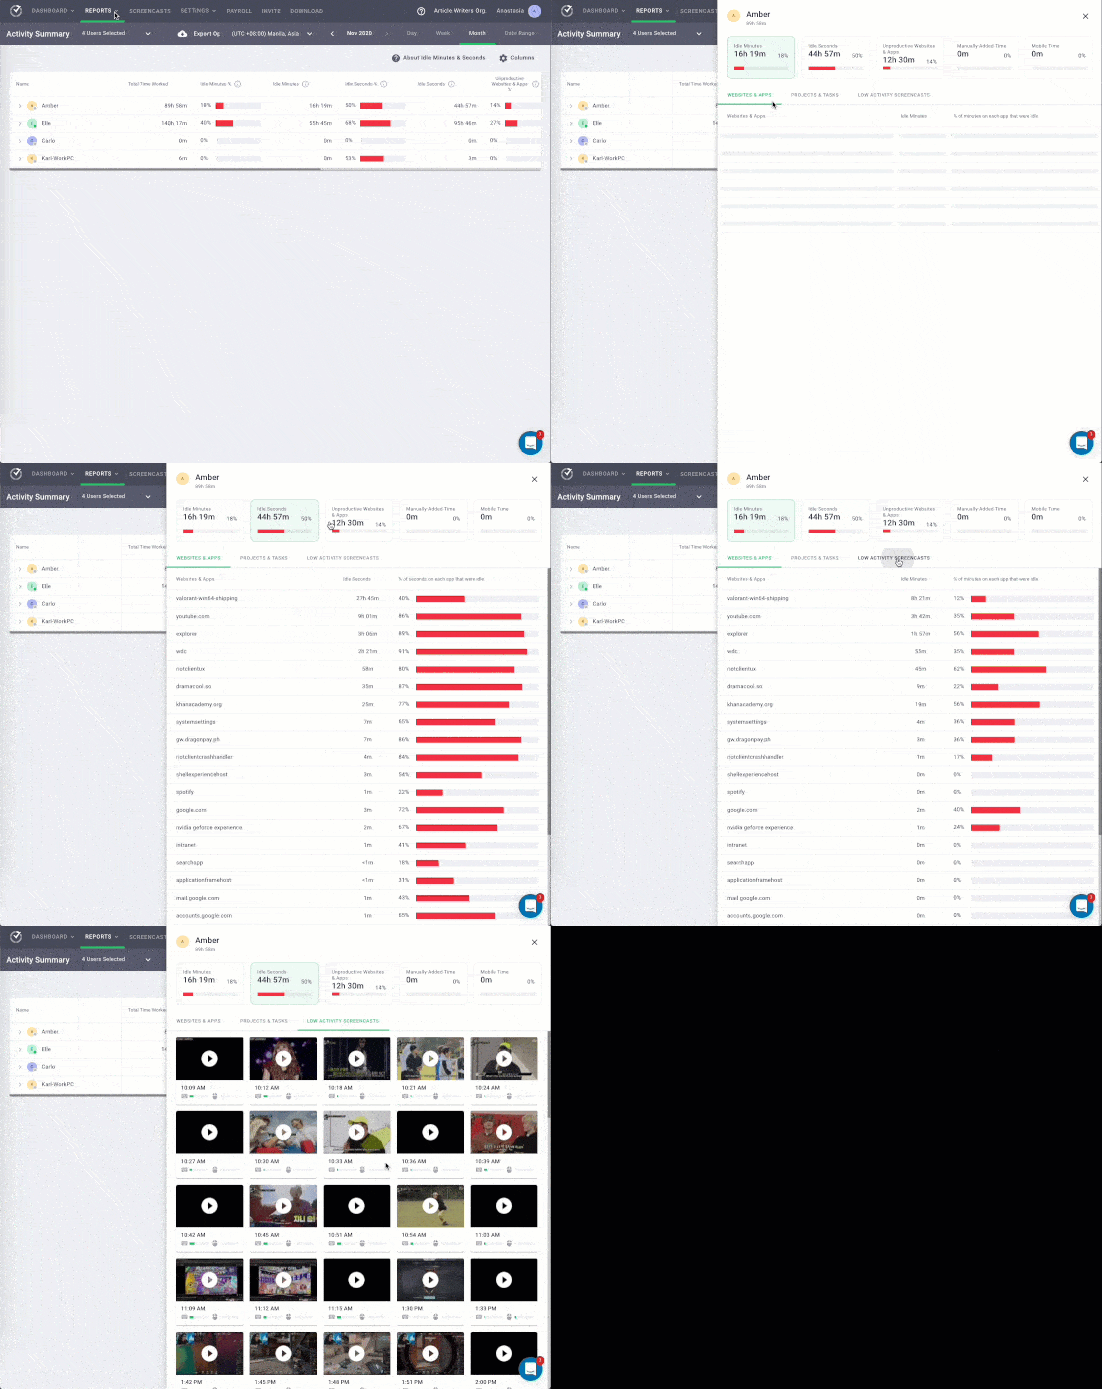
What it shows:
It shows each employee’s active seconds, minutes, unproductive, mobile, and manual team for a given period.
How to use it:
You can use this report to determine any productivity issues in your organization and compare the performance of employees who do similar tasks.
10. Customer satisfaction
The goal of measuring all the earlier performance indicators is to provide your customers with a better customer journey.
Above 60% of customers will switch to another brand if they receive one poor customer experience.
That’s why customer satisfaction is the ultimate KPI to measure call center performance.
You can measure customer satisfaction through quality assurance metrics like Net Promoter Score (NPS), Customer Effort Score (CES), and Customer Satisfaction Score (CSAT scores).
Wrapping up
Customer service is changing, and with it, the call center industry.
Your company needs to provide customers with great customer service across various platforms to survive in 2023. Tracking the metrics we mentioned is a good way to ensure that your company is satisfying customer wants and needs.
And with software like Time Doctor, you can monitor your agents’ work capacity and address performance issues to help them stay productive throughout the day.

Liam Martin is a co-founder of Time Doctor which is software to improve productivity and help keep track and know what your team is working on, even when working from home.

