Time Doctor customers have access to more than 5 different analytic reports that provide companies with workday insights and analytics spanning many different areas of their business operations.
Our reports were designed to provide our customers with actionable insights in an easy and digestible way so that they can quickly make improvements.
One of our most popular reports is the Web & App Usage report. Both managers and employees use this report to develop a deeper understanding of where and how they spend their workday. By measuring and analyzing how we spend our time, we gain the insights and direction we need to improve our performance and become better.
What is the web & app usage report?
The Web & App Usage report tracks how much time each user spends on specific websites and applications. This report has several preset view options as well the ability to view the data per user or by the website and application names. It will provide the total time worked with a breakdown of how much of this time was spent on productive, non-productive or neutral websites and apps.
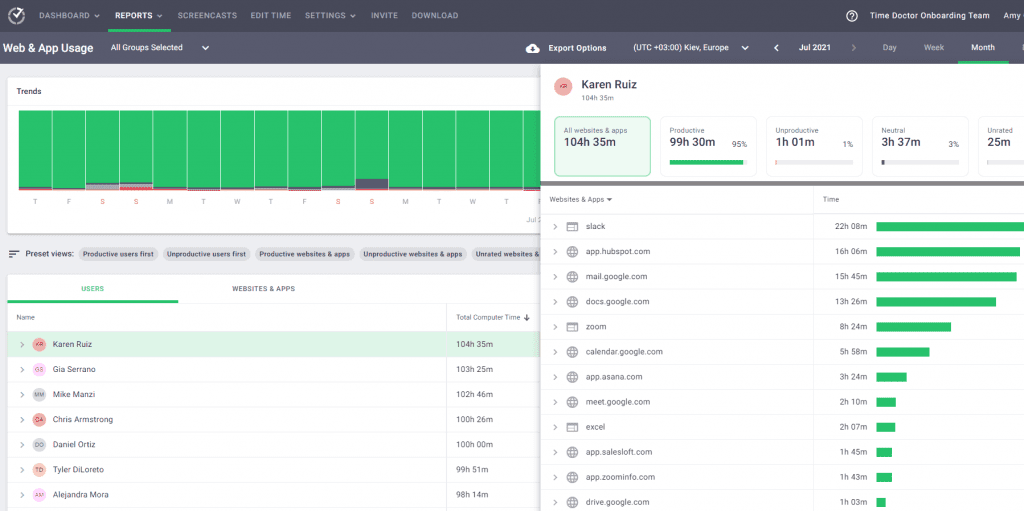
Each view also includes options to drill down further for additional details on how and where time is spent. The extended Web & App usage capabilities provide even deeper insights by showing what activities or tasks are being worked on in these applications or the page titles for websites visited.
How do you use the web & app usage report?
Knowing which websites employees visit and which applications employees spend their time in can provide valuable insights into the time management skills of your team. The Web & App Usage report can help identify what tasks and tools are considered productive to different job roles and teams as well as create more visibility into work patterns and processes.
We’ve compiled a list of the top 5 Workday Insights from the Web & App Usage report below, including tips on how managers and employees both can use these to improve performance and productivity.

Insight #1: Identify distractions and time-wasters
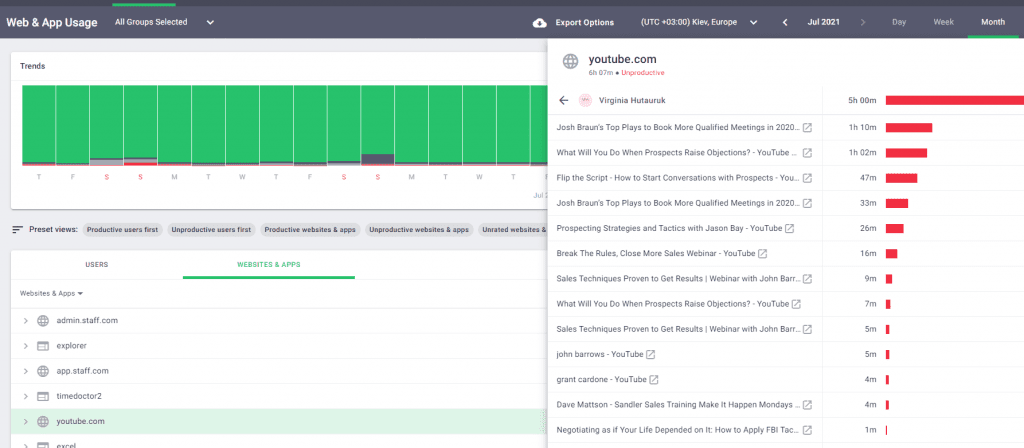
One of the easiest ways to improve productivity is to reduce the amount of distractions during the workday. Going beyond identifying the normal distractions like social media sites or youTube, the Web & App Usage report can provide insights into applications and sites that are typically considered productive, but might actually be preventing you from completing work.
How to make this insight actionable:
- Managers can quickly assess which sites and apps are distracting team members and help build policies around them. If lots of time is being spent on social media, you can decide how many hours per week or month spent on these sites is acceptable to your organization, thus creating clearer expectations for team members.
- Employees can analyze their most used applications and compare the amount of time spent in them against their task list. This allows them to determine if they are actually helping them to reach their goals. For example, Slack and Gmail are work-related applications and very important to your job, but they aren’t helpful in completing research projects.
Insight #2: Identify new cost saving opportunities
The Web & App Usage report can help companies optimize their resource management to identify new cost saving opportunities. Resource management is the process of planning and allocating resources to maximize efficiency. Resources include anything that is needed to execute a task and can range from employee skill sets, to tech stacks, to the number of computers an organization has. By accurately tracking both the efficiency of employee time and activity as well as the usage of technology, Time Doctor customers can become more profitable and save costs.
How to make this insight actionable:
- Identify applications that are no longer being used or are not used often. Get rid of unused seats or licenses to help save significant costs. See how this company used the Web & App usage data to SAVE 6 Figures!
- Uncover the applications that allow specific job roles or functions to be the most productive and make changes to processes or grant access to these apps, allowing these users to improve their efficiency.
- Analyze the total amount of unproductive time to monitor employee efficiency and identify areas of improvement to help improve productivity.
Insight #3: Understanding work patterns for accurate benchmarking
The Web & App Usage report is also a valuable tool to help identify the work patterns and processes of top performers, allowing leaders to create realistic and accurate benchmarks. By digging into where top performers spend their time, managers can create processes and benchmarks for the rest of the team that are attainable and clearly relate to their goals and KPIs.
How to make this insight actionable:
- Identify what applications top performers use the most and drill down into what tasks and activities they use these apps for. Set KPIs and processes based on this data so that all team members have clear direction and expectations on how they should be performing.
- Understand what applications and sites are the most important to a specific team or job role with the group and user filters. For example, if you see that the highest performing sales rep spends more hours on Hubspot compared to Intercom you can investigate further and see if processes need to be updated to use one application more than the other.
Insight #4: Identify training opportunities
Knowing what tools and sites are used the most is important, but knowing how much time is spent in them makes the Web & App usage report even more valuable. By understanding how much time is spent in these tools and comparing against the benchmarks mentioned earlier, employees and managers alike can uncover areas where additional training is needed.
How to make this insight actionable:
- Quickly identify the most used applications and dive into exactly how much time is being spent here. Using the new benchmarking data, identify the users that are spending more time here than the rest of the team, which will indicate the apps that need to have a refresh or more in-depth training centered around.
- View the Web & App Usage report data by the website and app name to analyze what tasks are associated with certain apps and how much time is being spent on them. This will let you easily spot users that might need a refresh on operational processes or workflows.
- If you see that a certain group of users spend more time in one app than others, and their overall performance isn’t as high, this could be a sign of lack of understanding or training needs.
Insight #5: Job role transparency for promotions
For Time Doctor customers that share data across teams, the Web & App Usage report can help provide more transparency and visibility into the projects and tasks that are expected of certain job roles. When employees can get a clearer picture of the expectations and skill sets needed for certain jobs, getting that promotion they want becomes much more attainable.
How to make this insight actionable:
- Employees can review the tasks and projects that are associated with the job role they desire and compare these against their current activities to make adjustments.
- Easily identify the tools that are required for certain job roles and build time into your work week dedicated to learning and expanding your skill set.
- Virtually job-shadow other employees in the job role you desire while still remaining productive and completing your own tasks on time.
This is just scratching the surface of how the Web & App Usage report can help you and your teams to improve performance and productivity. Take a deeper dive into this report by booking a personalized meeting with one of our experienced product specialists, or start a free 14-day trial today to start exploring this report on your own.

Amy Owens is a product marketing enthusiast with a passion for writing content that communicates the features, values, and benefits of products.