Employee engagement analytics is the practice of measuring and evaluating the employee experience. With these actionable insights, you can assess employee well-being and uncover how satisfied your team actually is at work.
Why is measuring employee engagement so crucial for your team? Positive engagement metrics often correlate with low employee turnover rates and high productivity rates—both of which can benefit your business.
In this article, we’ll cover what you can learn from employee engagement analytics, explore which metrics to measure, and share resources and methods to help you get started.
Table of Contents
- The case for measuring employee engagement
- Measure employee engagement with these 9 metrics
- Time Doctor has the employee engagement analytics you need
The case for measuring employee engagement
Cultivating an engaged workforce is about much more than ensuring happy employees, although that’s certainly a factor. Measuring engagement and maintaining positive results can pay off in several ways. Let’s take a look at some key employee engagement stats and benefits:
- Productivity: Engaged employees are 14% more productive compared to their counterparts. As a result, they can complete more tasks in the same amount of time or require fewer resources to do their jobs effectively.
- Absenteeism: Business units with engaged employees report up to 81% lower absentee rates. That means employees are significantly more likely to work scheduled shifts and report for work on time, making it easier for you to manage costs and coverage.
- Turnover: For highly engaged teams, the benefits go beyond good attendance. These teams are more loyal, reporting up to 43% lower employee attrition rates. As a result, you can spend less time and money on recruitment and training new employees.
- Customer satisfaction: Happier employees often mean more satisfied customers, which can positively impact your business’s bottom line. Customers give engaged employees a 10% higher rating on average, which may also lead to improved loyalty.
- Sales and revenue: An engaged workforce can drive nearly 20% higher sales numbers. In other words, focusing on employee satisfaction can significantly impact your business’s growth and success.
- Profitability: According to Gallup, highly engaged business units experience a 23% difference in profitability. With metrics like that, it’s easy to see how employee well-being directly translates to better business outcomes.
Measure employee engagement with these 9 metrics
Before you can leverage the benefits of an engaged team, you need an objective way to track their job satisfaction and well-being. Use the metrics below to guide how you measure employee engagement data.
1. Pulse surveys
One of the easiest ways for HR professionals to track employee engagement is by creating custom pulse surveys. These surveys tend to be brief and sent with some regularity (e.g., monthly). You can include questions about several topics, such as:
- How much access employees have to necessary resources
- How committed employees are to the company’s mission
- If employees feel they have enough professional development opportunities
Most pulse surveys are anonymous, allowing employees to respond candidly. As a result, the survey data can’t tell you about individual employees. However, it can help you measure engagement across the company.
One way to evaluate individual employee data from these surveys is to check participation rates. Employees who rarely complete these surveys may be particularly disengaged.
No matter how you decide to measure, you can easily administer these surveys with employee engagement software like Culture Amp and Qualtrics.
2. Employee satisfaction index (ESI)
While employee engagement surveys can include a wide range of questions, measuring employee satisfaction requires more specificity. To check your team’s ESI, ask employees these three questions:
- How satisfied would you say you are with your employer?
- How well does your employer meet your professional expectations?
- How closely does your position align with your ideal role?
Have employees rate their responses on a scale of 1 to 10. Then, factor their responses into the formula below to calculate their ESI, which falls on a scale between 1 and 100.

This survey may be relatively simple, but it generates an easy metric to keep measuring over time. Once you establish a benchmark, you can continue measuring against it to spot trends and see how employee satisfaction has changed.
3. Employee net promoter score (eNPS)
Although you may be more used to net promoter scores (NPS) as they apply to customers, HR professionals can use a similar approach for employee engagement. The eNPS responses measure engagement and how much employees promote the workplace.
Similar to ESI, measuring eNPS requires just a brief survey. In fact, eNPS surveys usually include a single question, with responses on a scale of 0 to 10:
- How likely are you to recommend getting a job at our company to a friend or colleague?
Employees who respond between 0 and 6 are considered detractors, while those who answer 9 or 10 are considered promoters. Anyone who responds 7 or 8 is labeled passive, and you don’t include their score in the calculation.
Next, use the formula below to calculate eNPS:

Like ESI, eNPS is a helpful metric to revisit periodically. Benchmarking these HR analytics lets you collect historical data and note trends. You can then be sure your employee engagement rate is moving in a positive direction.
4. Productivity rating
As useful as surveys are, they can easily reflect an employee’s subjective experience at a given moment. Balance the results by considering objective data like employee productivity.
By measuring productivity, you can assess employee engagement levels with their roles and tasks on specific days and over much longer periods.
Solutions like Time Doctor can measure productivity automatically. The software tracks when employees work and the tasks and projects they work on. It also monitors the websites they visit and the apps they use at work.
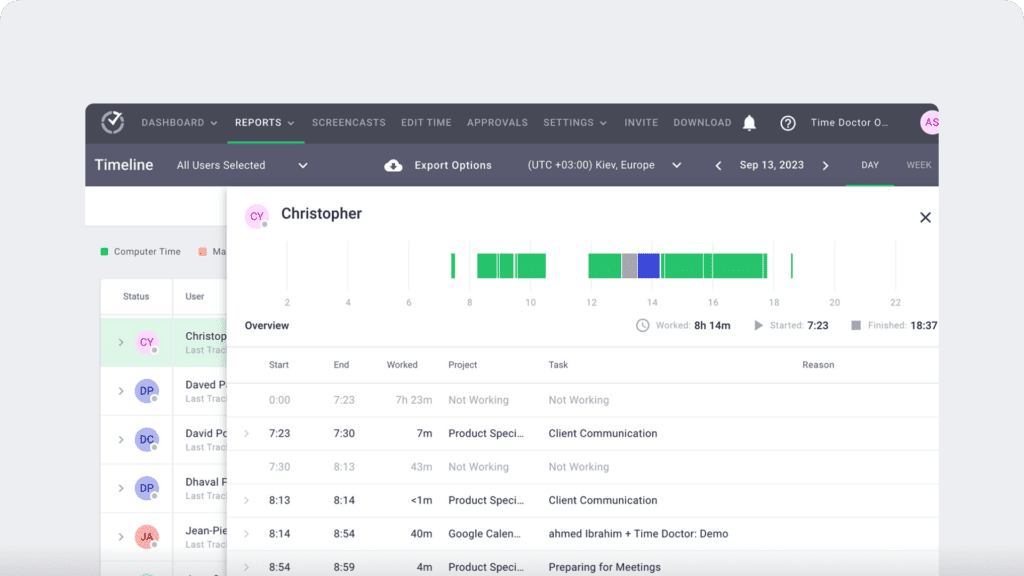
Time Doctor can rate each website or app as productive or unproductive based on your admin team’s custom labels. It displays a productivity percentage for each employee over the day, week, or month.
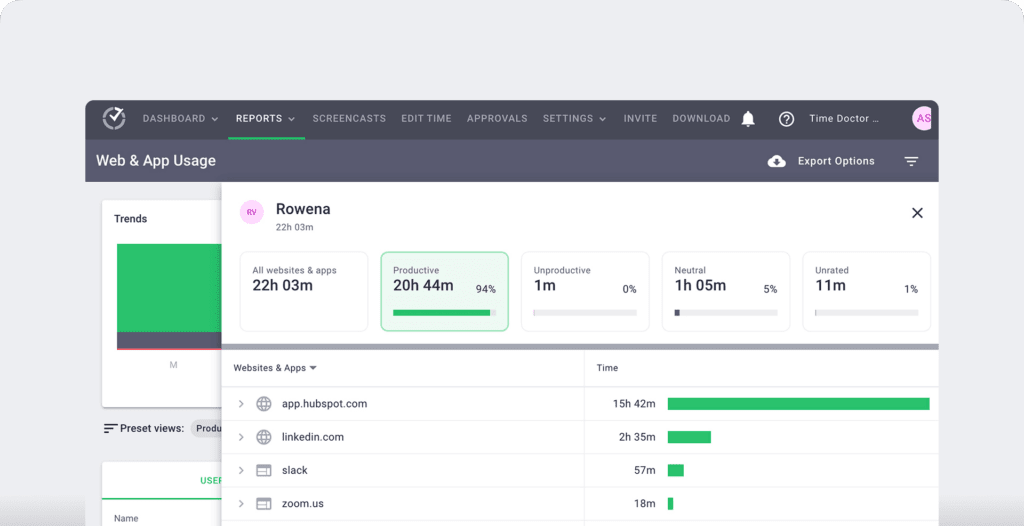
You can use these data-driven insights to see how employee engagement changes over time. To address low productivity scores, you can talk with team members about motivation, workload, or other issues that may be affecting their performance.
5. Objectives and key results (OKR) alignment
Are your team members setting goals that are realistic yet ambitious? Understanding whether they align with OKRs can give you more subjective data points around employee engagement.
The best way to discuss goal setting, check alignment, and get employee feedback is via one-on-one meetings with managers. Apps like Fellow can help you plan these meetings and get maximum value from them while creating a culture of continuous feedback.
6. Work-life balance
Ideally, your employees are satisfied and look forward to their jobs. However, working too much may not be a positive sign.
By measuring work-life balance, you can ensure your team doesn’t overwork. Over time, overwork can lead to burnout, which can cause employees to take unplanned absences or leave their jobs.
Tools like Time Doctor automatically measure work-life balance based on your custom settings. For example, you may set a threshold to identify employees who work more than a set number of hours or a certain number of evenings each week.
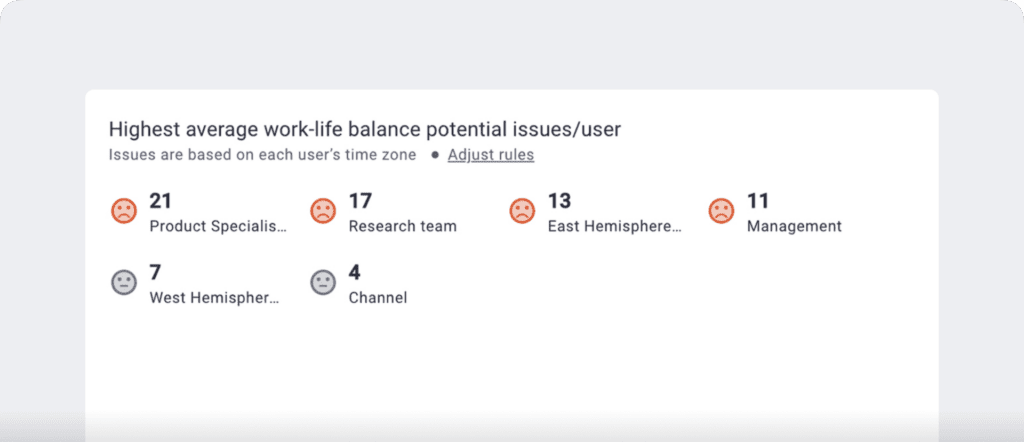
Then, you can take action based on these insights. For example, you could lighten the workload of some employees or guide them toward more efficient workloads.
7. Employee absenteeism rate
Employees’ paid time off (PTO) and scheduled absences shouldn’t reflect their engagement rate. However, a high number of unplanned absences can reflect disengaged behavior.
Software like Time Doctor automatically tracks employee attendance, including absences. You can plug this data into the formula below to track employee absenteeism rates:


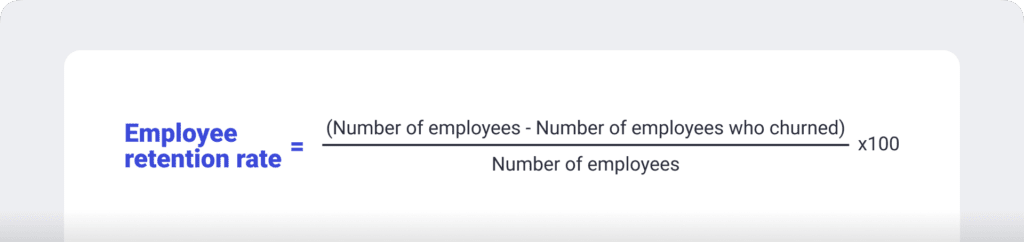
8. Employee retention rate
An engaged workforce generally has a high retention rate, meaning employees remain committed to the company and their roles. To track this HR metric, use the following formula:
To get a complete picture of employee retention, it’s also helpful to measure the counterpart to this metric, which is the employee turnover rate:
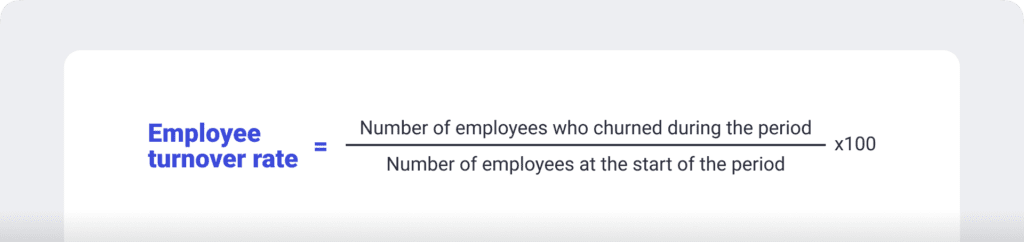
9. Employee development
One of the most effective ways to improve engagement and retain employees is to help them advance along their career paths. After all, your top talent likely aspires to take on more responsibility and work toward promotions.
To help them reach their goals while remaining engaged with their current positions, give them access to professional development resources and opportunities. People management platforms like Lattice can help employees create and carry out professional development plans—and measure their progress along the way.
Time Doctor has the employee engagement analytics you need
You can cultivate an engaged workforce by combining the right technology with proactive and empathetic management. Time tracking software like Time Doctor provides valuable insights that enable better employee engagement.
With this platform, your management team can reliably and accurately measure attendance, productivity, and well-being. Request a Time Doctor demo to see how our automated tracking and insights can benefit your team.


Liam Martin is a serial entrepreneur, co-founder of Time Doctor, Staff.com, and the Running Remote Conference, and author of the Wall Street Journal bestseller, “Running Remote.” He advocates for remote work and helps businesses optimize their remote teams.