Providing an excellent customer experience (CX) is crucial for customer retention and gaining new business.
Fortunately, you can use customer experience metrics to determine how effective your customer experience initiatives are and what needs improvement. You can gain insights into how satisfied customers are with your offerings, how likely they’re to recommend your company, and more.
In this article, we’ll explore what customer experience metrics are and highlight 11 key CX metrics. We’ll also guide you to choose the right CX metrics for your business.
This article includes:
(Click on the link to go to a particular section)
- What are Customer Experience Metrics?
- 11 Key Customer Experience Metrics
- How to Choose Which Metrics to Track?
Let’s get started.
What are customer experience metrics?
Customer experience metrics are the KPIs (Key Performance Indicators) that help businesses gauge customer experience. These metrics help organizations analyze their service after key touchpoints.
Customer experience metrics are the results of every interaction a customer has with your business, from visiting your website to giving feedback after a purchase.
With excellent customer experience, you can:
- Increase customer loyalty and retention rate.
- Boost customer satisfaction.
- Create a great brand reputation via word-of-mouth marketing and positive reviews.
Looking for ways to improve customer experience?
Check out our guide to improve customer experience in 10 easy steps.
11 key customer experience metrics
Here are 11 important customer experience metrics businesses should track today:
1. Net promoter score
Net Promoter Score (NPS) measures your customer loyalty. This metric is usually considered the gold standard of customer experience metrics.
An NPS survey presents your customer with two simple questions:
A. Rating question
Usually, a buyer is asked this survey question at the end of their customer journey:
On a scale of 0 to 10, how likely are you to recommend our business to a friend or colleague?
Based on the rating respondents give, you can classify them into:
- Promoters: Responded with 9-10.
- Passives: Responded with 7-8.
- Detractors: Responded with 0-6.
B. Follow-up question asking the reason for the given score
This question gives you insight into features that increased or decreased your previous score.
Here’s a follow-up question example:
- What’s the primary reason for your score?
How to calculate the NPS score?

For example, if 4% of respondents are detractors and 78% are promoters, your NPS score will be 74.
NPS benchmark score
On average, the standard NPS scores for B2B industries range from 3 to 62 and for B2C companies from 24 to 57.
Here are the NPS benchmark scores of different industries:
- Consulting: 62
- Cloud and Hosting: 45
- Healthcare: 38
- Logistics and Transportation: 3
2. Customer loyalty index
Customer Loyalty Index (CLI) is a metric that tracks customer loyalty over a period of time — it usually considers NPS too.
It measures the count of loyal customers who’ll recommend your company to others, engage in repetitive purchasing, and try your other products or services.
The questions asked in a CLI survey include:
- How likely are you to recommend [the company] to your friends and family?
- How likely are you to buy from [the company] again?
- How likely are you to try [the company’s other products?
Customers are asked to rate the questions on a scale of 1-6, 1 being ‘Definitely Yes’ and 6 being ‘Definitely No.’ You can assign scores for each rating, like:
- 1: 100 points
- 2: 80 points
- 3: 60 points
- 4: 40 points
- 5: 20 points
- 6: 0 points
How to calculate customer loyalty index?
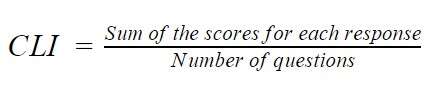
Let’s say a customer’s score for the 1st question is 80, 2nd is 100, and 3rd is 80. Then their CLI is 87.
Customer loyalty index benchmark
Customer loyalty benchmark considers multiple factors like NPS, upselling, and repurchasing. This is why you can’t sum it up in a single number.
3. Customer satisfaction score
Customer Satisfaction Score (CSAT) measures how satisfied customers are with your services or products.
You can ask customers to rate their overall satisfaction at different touchpoints. The rating scale ranges from 1-3, 1-5, or 1-10 or from ‘Very Satisfied’ to ‘Not At All Satisfied.’
You can obtain a Customer Satisfaction Score by conducting a CSAT survey asking your customer a simple question:
- How satisfied are you with your experience?
How to calculate CSAT score?
Customer Satisfaction Score is the sum of all positive responses divided by total responses and multiplied by 100.
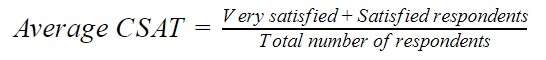
For example, if you received 34 very satisfied and 16 satisfied responses out of 100 responses, your customer satisfaction score will be 50.
CSAT benchmark score
Like NPS, Customer Satisfaction Score also varies from one industry to another. A good Customer Satisfaction Score typically falls between 75% and 85%.
Here are a few Customer Satisfaction Scores from different industries:
- Apparel: 79
- Automobiles and light vehicles: 78
- Financial advisors: 77
- Online travel services: 74
4. Customer effort score
Customer Effort Score (CES) is a metric measuring the effort a customer has to exert to get:
- An issue resolved.
- A question answered.
- A request achieved.
- A product purchased or returned.
This KPI helps you recognize customer journey obstacles. By reducing the Customer Effort Score, you can increase customer loyalty and satisfaction.
A CES survey asks customers one question. Different forms of the question are:
- How much effort did you have to put in to resolve the issue? (With a scale ranging from 1-7)
- [Company] made it easy for me to handle my issue. (With a scale ranging from disagree to agree)
How to calculate the customer effort score?
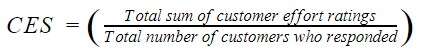
For example, if the customer effort ratings are 8, 5, and 8, and the number of respondents is 3, the Customer Effort Score will be 7.
CES benchmark score
There’s no benchmark Customer Effort Score — however, the higher your CES score, the better.
5. Referral rate
Referral rate is the measure of referred purchases in the company.
You have to provide customers a positive experience so that they refer your products or services to others. A happy and loyal customer will provide you higher referral rates.
How to calculate the referral rate?

For example, if the count of referred purchases is 10 and the total purchases is 30, the referral rate is 33%.
Referral rate benchmark
Usually, the referral rate across different industries is:
- Electronics: 3.4%
- Food: 2.56%
- Apparel and fashion: 2.23%
- Cosmetics: 2.2%
6. Churn rate
Customer churn rate shows the number of customers who’ll stop coming to you over a period. These unhappy customers won’t repeat purchases, follow your brand on social media, or continue a recurring service.
How to calculate the churn rate?

For example, if your company lost 50 customers during a specific timeframe and had 200 active customers at the beginning of the timeframe, your customer churn rate is 25%.
Churn rate benchmark
Typically, a healthy customer churn rate is 7.5% per month. Here’s how it varies based on industries:
- Education: 9.6%
- Consumer services: 7.5%
- Media and entertainment: 5.2%
- Software as service (SaaS): 4.8%
7. Retention rate
Customer Retention Rate (CRR) is the percentage of customers who come back to you for products or services. Identify your customers’ favorite traits about your product or service by measuring the retention rate at different touchpoints in the customer journey.
How to calculate retention rate?
There are two ways to calculate retention rate:
A. Churn rate
Retention rate is the opposite of customer churn rate, and adding both will give you 100. So, if your churn rate is 35%, then your retention rate will be 65%.
B. Direct method

Let’s say, towards the end of a year, the total number of customers is 67, the count of new customers is 7, and you had 100 customers at the beginning of the same year.
Then, the retention rate is 60%.
Retention rate benchmark
Here are the average retention rates of prominent industries after 30 days:
- Media and entertainment: 43%
- Retail or eCommerce: 37%
- Travel: 36%
- Gaming: 27%
8. Average resolution time
Average resolution time is the total time your customer support team takes to resolve a problem.
When the average resolution time increases, the CSAT score decreases.
Similarly, a low average resolution time corresponds to a high CSAT score.
How to calculate the average resolution time?
Here’s the formula:
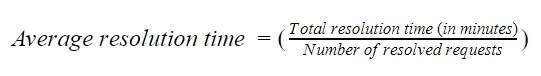
So, if your team spent 5 hours resolving issues and solved 50 queries, then the average resolution time is 6 minutes.
Average resolution time benchmark
The resolution time without escalation is usually more than 4 minutes for phone-based support.
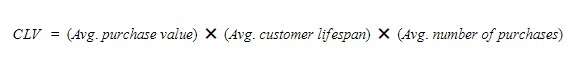
9. Customer lifetime value
Customer Lifetime Value (CLV) is the amount of revenue a particular customer relationship will yield throughout the relationship. The customer experience KPI basically tells you how much revenue a customer brings to the organization, helping you retain highly valuable ones.
How to calculate CLV?
Customer Lifetime Value is the product of three aspects:
- Average purchase value: The average value of each purchase made by your customer.
- Average customer lifespan: The average number of days between the first and last order date.
- Average number of purchases: The average purchases made during a particular time frame.
Customer lifetime value benchmark
Usually, a good CLV will be three times more than the customer acquisition cost.
10. Customer acquisition cost
Customer acquisition cost is the total amount of money spent on getting each new customer. It depends on marketing techniques like word of mouth, advertisements, etc.
Companies that provide a high-quality customer experience will have to spend less on gaining new customers. So, high customer acquisition cost means your customer experience is low.
How to calculate customer acquisition cost?
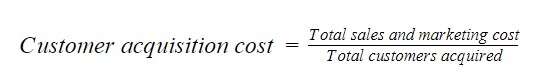
Let’s say you spend $100 on product sales and marketing and gain 5 customers. The customer acquisition cost will be $20.
Customer acquisition benchmark
A good customer acquisition cost will be at a ratio of 1:3 with your CLV.
Here are the average customer acquisition costs in different industries:
- Law (Business/Commercial): $584
- Business consulting: $410
- Oil & gas: $710
- Pharmaceutical: $196
11. Employee engagement score
Employee Engagement Score is the measure of enthusiasm and dedication an employee feels towards the company.
An engaged employee is more likely to go the extra mile to ensure that customer experience is high. So, the higher the employee engagement is, the better the customer experience.
Ask your employees a few questions to easily track employee engagement:
- Would you recommend the company as a good place to work for a close friend/family member?
- Does [Company] contribute to my personal development?
Each question is given a particular weightage, such that they add up to form 5, 10, or any other whole number. For example, you can allot scores for each question:
- 9-10: 100 points
- 7-8: 80 points
- 5-6: 60 points
- 3-4: 40 points
- Below 3: 0 points
How to calculate employee engagement score?
Determine the employee engagement score by taking the average of the scores in the survey.
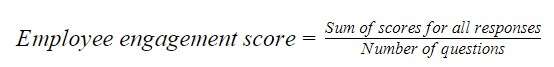
For example, if you ask an employee two questions and the scores of their answers are 50 and 10, the engagement score will be 30.
Employee engagement score benchmark
The average employee engagement score across different industries is:
- Leisure and hospitality: 80
- Real estate: 76
- Construction: 76
- Manufacturing: 70
Other customer experience KPIs include First Contact Resolution (FCR), up-sell and cross-sell rates, behavioral analytics, conversion rate, etc.
But remember, you don’t need all these customer experience metrics for CX measurement. Just choose the ones most relevant to your business.
Let’s see how to do that.
How to choose which CX metrics to track?
Here are a few factors you should consider while choosing your CX metrics:
1. CX priorities
Determine why you’re measuring customer experience before you choose a metric.
For example, you can measure the churn rate and CES to reduce the number of lost customers. And if your business doesn’t have a referral program, there’s no point measuring the referral rate.
2. Customer journey
Customer expectations vary as they progress through the customer journey.
This is why you need to measure customer experience at different touchpoints in their journey to understand what they like about your brand and gauge their overall experience.
For example, a customer who just visited your website may not fully understand your service levels or product quality. But with time and experience, they’ll be able to give more detailed feedback on specific touchpoints like purchase, after-sales service, etc.
3. Ask customer feedback the right way
Approach your customer via the channel they usually contact you through and when they’re most likely to be free. You can analyze customer behavior to find out both these pieces of information.
Note: If you want to measure multiple CX metrics, you can use CX software. You can consolidate all relevant metrics into a CX dashboard and construct a plan with the right tool.
Wrapping up
Measuring customer experience can help you recognize the company’s strong points and weaknesses.
It’ll help you transform an unhappy customer into a happy customer by making improvements based on your customer experience measurement observations.
To ensure a great customer experience, you can plan a CX strategy by calculating the CX score with the relevant CX metrics. Use this CX metrics list to choose the best ones for your company’s CX success.


Carlo Borja is the Content Marketing Manager of Time Doctor, a workforce analytics software for distributed teams. He is a remote work advocate, a father and an avid coffee drinker.