How often do you see your operation slow down or experience unexpected downtime without a clear reason?
Quick overview
Data-driven process optimization helps you improve workflow by revealing where time goes, where work slows, and what needs to change. With real-time visibility into cycle time, workload balance, and application usage, you can spot bottlenecks, reduce waste, and make smarter decisions.
Workforce analytics tools like Time Doctor make these insights easier to use and act on.
Without reliable real-time data or effective analytics tools, you rely on assumptions instead of insight. You can’t see where time is wasted, which applications drain focus, or how much work gets lost to low-value activity.
Usage data gets scattered across tools, dashboards fail to tell the whole story, and shadow SaaS systems make it even harder to track what’s actually happening.
These blind spots make it challenging to optimize processes or align time with business priorities across your workflows and supply chain operations, slowing your path to operational excellence.
Table of Contents
- What does data-driven process optimization actually give you?
- The 5 stages of a modern data-driven optimization approach
- The signals you need for effective data-driven process optimization
- What business impact can you expect from a data-driven optimization approach?
- Industry scenarios where data-driven optimization makes an impact
- How does Time Doctor support data-driven process optimization?
- Final thought
- Frequently asked questions (FAQs)
What does data-driven process optimization actually give you?
Data-driven process optimization gives you the operational visibility you need by showing the power of data in understanding how work really moves through your teams.
Instead of piecing together assumptions from scattered dashboards or manual reports, you get clear signals about the patterns shaping your day-to-day execution.
You gain clarity into the results of strong data collection practices and the data-driven strategies that come from them.
Here are the key things you can uncover:
- How workflows behave in real life, including cycle time, task duration, handoffs, and where delays accumulate
- Where inefficiencies come from, using real-time usage data and application activity to reveal the tasks that slow down your processes
- Which tools help your team and which ones create friction, especially when analyzed with predictive analytics
- What work distracts teams from their priorities, including low-value tasks, repetitive work, or unnecessary steps that create waste.
- How remote, hybrid, and in-office teams work differently so you can compare execution, apply predictive maintenance insights, and standardize best practices
- Where automation can help by reducing rework and pointing out tasks that drain team capacity
- Chances to boost efficiency by focusing time on the work that matters most in your production processes
This approach transforms daily activity into useful insights, allowing you to improve workflows and make data-driven, informed decisions.
The 5 stages of a modern data-driven optimization approach
A data-driven process optimization approach gives you a structured way to improve operational efficiency without relying on assumptions. You follow a progression that helps you see how work actually happens, where it slows down, and what needs to change.
Each stage gives you the visibility and insight to lead with confidence.
1. Identify
Using a data-driven approach, you identify the workflows that have the greatest impact on your operation. You look for signs of rising cycle time, repetitive delays, or tasks that consistently pile up. This step helps you surface the processes that drain efficiency or create unnecessary friction.
2. Measure
You collect real-time signals that reveal how work truly flows. You track task duration, workloads, app usage, and momentum breakers. AI-enhanced benchmarking reveals how remote, hybrid, and in-office teams differ, providing a solid baseline for improvement.
3. Analyze
You analyze the data to understand workflow behavior and how it affects your KPIs (Key Performance Indicators). You review real-time signals, usage data, and performance patterns to identify the causes of delays. In data analysis, you compare how teams work across different environments and identify where automation or workflow changes will have the greatest impact.
4. Improve
You use your findings to optimize the workflow by simplifying steps, improving handoffs, balancing workloads, and removing unnecessary tasks. The goal is a smoother, more efficient process without added complexity.
5. Sustain
You maintain momentum by monitoring your processes with real-time insights. Tracking trends, usage patterns, and workload shifts helps you act early and build a continuous improvement loop and not just a one-time fix.
The signals you need for effective data-driven process optimization
The right signals help you support your teams, improve efficiency, and make data-driven decisions, without micromanaging.
Here are the core signals you rely on:
Cycle time and task duration
You see how long each step takes and where work slows. These metrics show how your processes really flow, so you can act early to avoid delays that hurt efficiency.
Workload balance across teams
You see how work is distributed across your teams. Real-time data shows when remote, hybrid, or in-office teams are overloaded or underused, helping you rebalance before burnout or missed deadlines.
Usage data from your tools
You review software usage to see which tools help and which ones create friction so you can identify the root causes of inefficiency. This makes it easier to simplify your tech stack, cut hidden costs, and remove tools that don’t add value.
Application usage and activity patterns
You analyze where time disappears into repetitive tasks, context switching, or low-value activity to uncover valuable insights. These patterns guide better time management and coaching, so you help teams focus on work that actually moves the needle.
Process interruptions and workflow breaks
You identify the steps that repeatedly break momentum. Seeing these points clearly in your workflow data helps you remove friction and improve functionality without adding complexity for your teams.
AI-powered benchmarking and trend analysis
You use AI-enhanced benchmarks, which compare actual performance to best practices or targets, so you’re not guessing. Trend analysis powered by machine learning shows where things are improving or slowing, guiding smarter optimization.
What business impact can you expect from a data-driven optimization approach?
Making decisions with real-time insights makes operations easier, more scalable, and more predictable.
“Data-driven decision making transforms operational efficiency by identifying and eliminating process bottlenecks,” according to SixSigma.us.
Here are the strategic outcomes that start to take shape.
1. Sharper operational execution
Operational patterns become easier to see, helping you identify which workflows work well and which ones slow teams down. With consistent metrics and usage data, execution improves and efficiency rises.
2. Smarter, faster decision-making
Real-time insights help you act faster by showing problems earlier. They make it easier to set priorities, spot risks sooner, and make accurate decisions that support long-term efficiency.
3. Stronger alignment across teams and locations
It’s easier to standardize expectations when all teams use the same data and create actionable insights from it. This leads to less variation, better accountability, and stronger efficiency.
4. Better use of people and tools
Resource allocation improves when you can clearly see workload patterns, capacity limits, and software usage. High-impact tasks get priority, while low-value work and redundant tools are reduced or removed.
5. Lower operational risk
Early signs of cycle time shifts or workflow breaks help you catch issues quickly. This protects service quality and keeps customer experiences strong while reducing delays and bottlenecks.
6. A culture of continuous improvement
Insights turn into action. Trend analysis, benchmarking, and real-time visibility form a continuous improvement methodology that boosts efficiency and reduces waste.
Industry scenarios where data-driven optimization makes an impact
These scenarios show how real-time insights, workflow data, and productivity analytics help you improve efficiency across different environments.
Healthcare
- Streamline administrative workflows and reduce processing delays.
- Improve patient-facing operations by removing unnecessary manual steps and optimizing task flow.
Banking and Finance
- Shorten high-volume processes such as documentation review or compliance checks to improve overall customer satisfaction.
- Strengthen audit readiness by improving execution consistency and predictability.
Insurance
- Reduce rework and cycle time in claims, underwriting, and policy management, as often highlighted in an Insurance workflow case study.
- Improve accuracy and efficiency across long, repetitive workflows.
BPO and Contact Centers
- Use advanced analytics to track SLA performance and reduce operational waste more clearly.
- Improve consistency across global teams and client accounts with intelligent algorithms.
Agencies and Technology Teams
- Increase billable utilization and eliminate cluttered software usage to improve overall profitability.
- Surface hidden inefficiencies in project workflows and improve delivery speed.
These examples show how data-driven optimization, backed by diverse data sources, helps you improve efficiency, reduce friction, and strengthen performance across any team setup.
How does Time Doctor support data-driven process optimization?
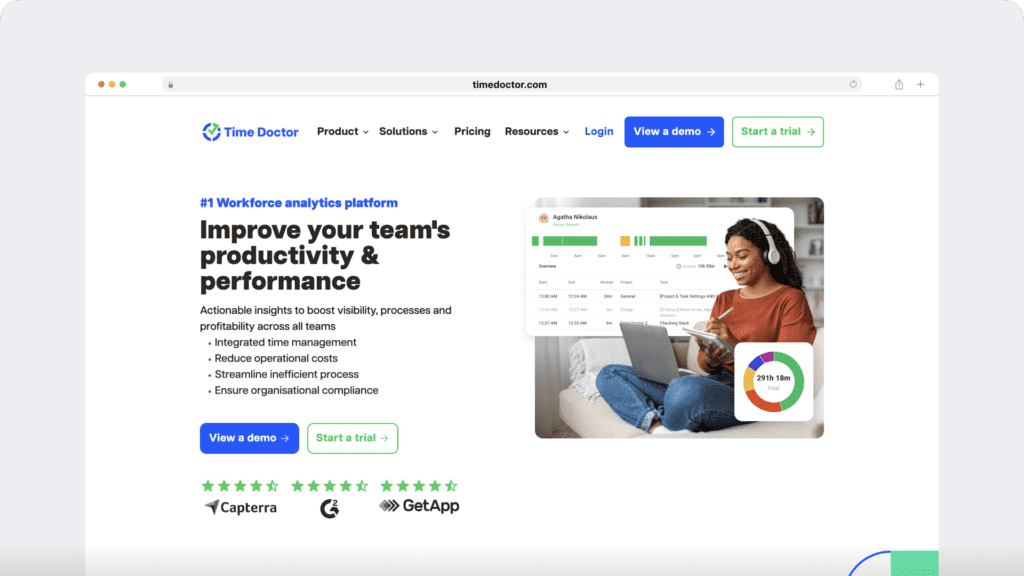
Time Doctor is the workforce analytics platform that empowers you with the visibility to lead with trust, not control. Instead of guessing where your processes slow down, you see real-time, data-driven insights and AI-enhanced signals that show how work actually happens across your remote, hybrid, and in-office teams.
This clarity supports faster, smarter decisions based on solid data integrity, helping you work more efficiently with less friction.
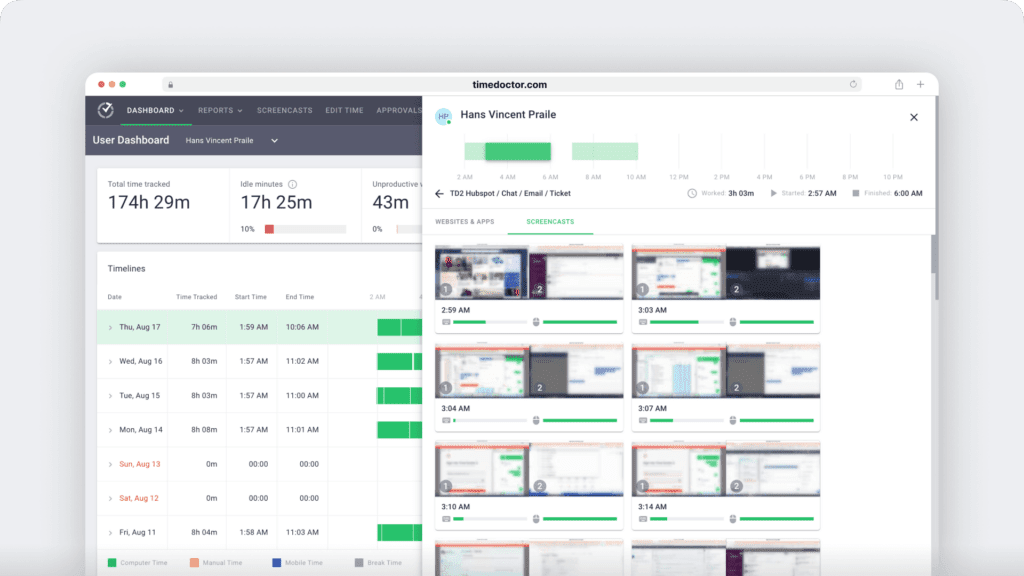
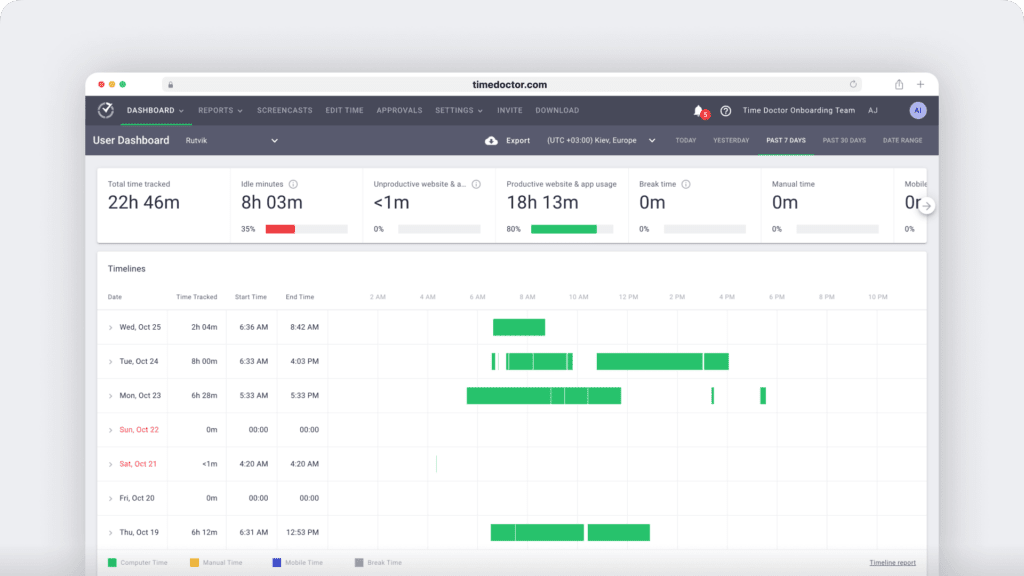
Employee Time Tracking for accurate workflow visibility
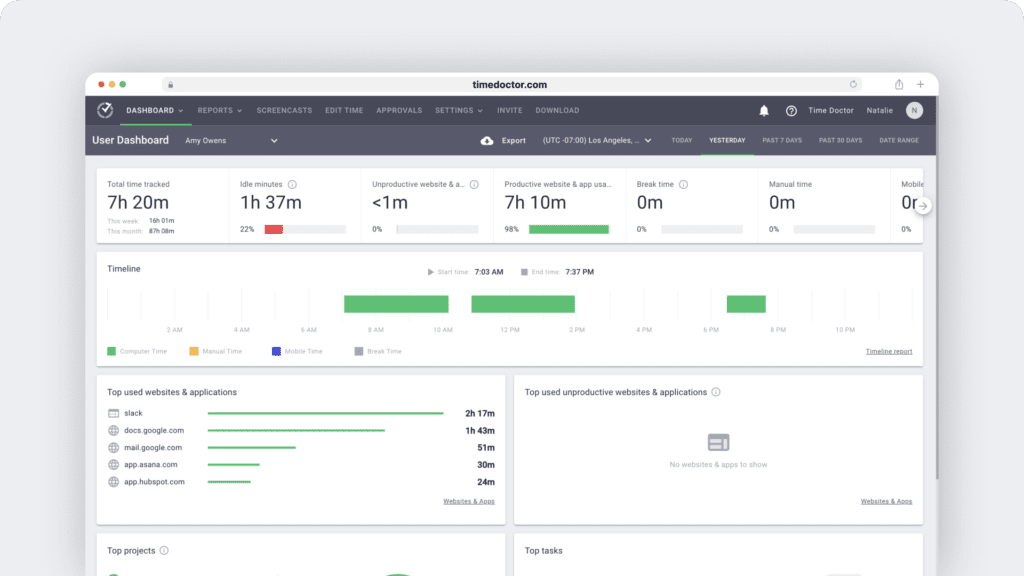
With Time Doctor’s time tracking, you see how long tasks actually take, where time is spent, and where cycle time increases. This helps you pinpoint inefficiencies and identify which steps slow down your business processes.
Productivity Analytics to uncover bottlenecks
Activity patterns and performance metrics highlight rework, delays, and dips in focus before they escalate. This supports faster, smarter workflow improvements.
Benchmarks AI for smarter comparisons
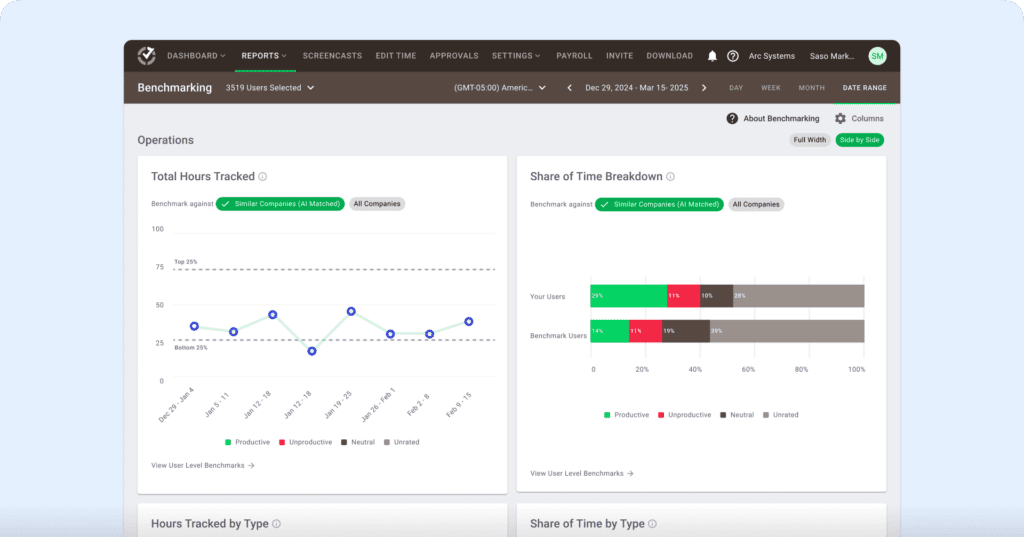
AI-powered benchmarking reveals unusual patterns across remote, hybrid, and in-office teams, helping you identify hidden inefficiencies and opportunities for optimization.
Meeting Insights to protect focus time and prevent overload
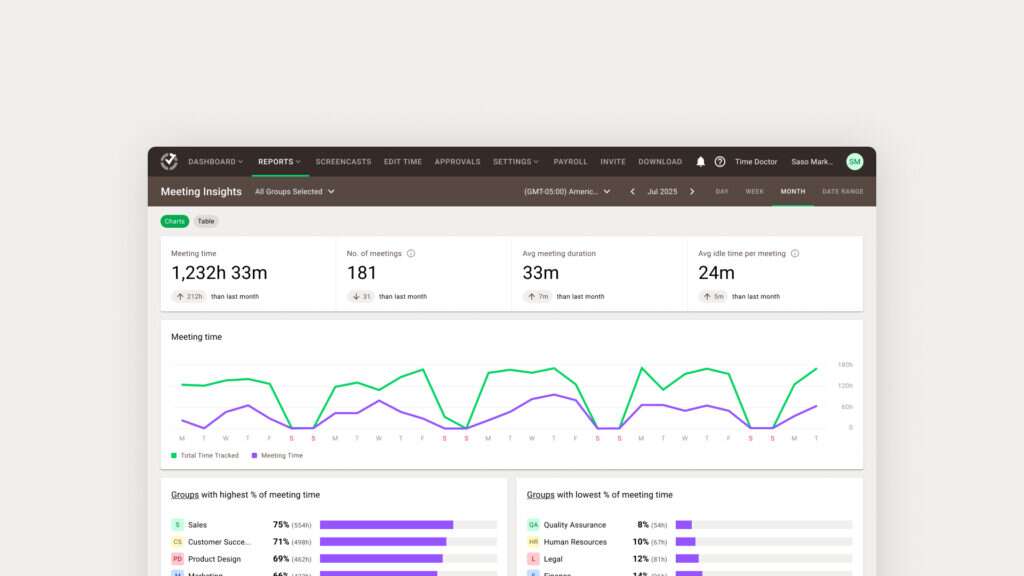
You see how much time teams spend in meetings and where long or recurring meetings disrupt workflow, using statistical analysis to spot meaningful patterns. This helps you cut unnecessary meetings, protect deep work, and improve efficiency.
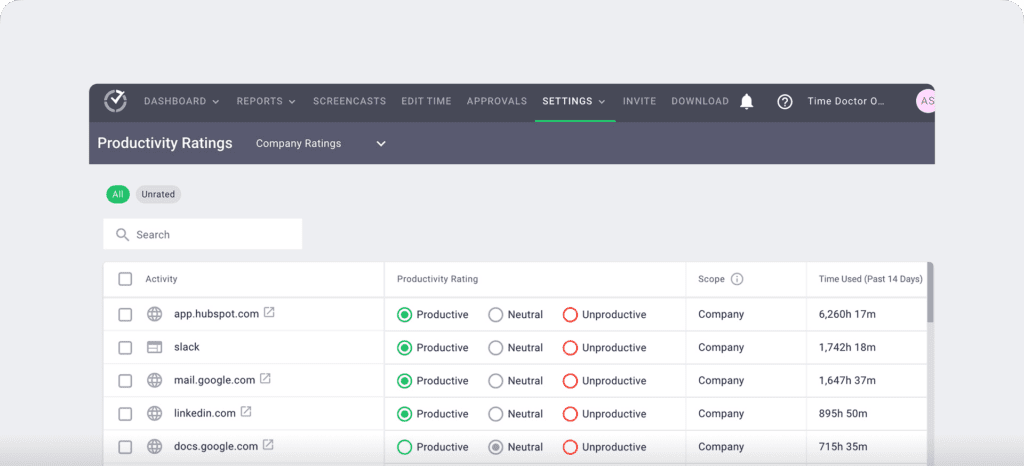
Software and Screen Monitoring to simplify tool usage
Application usage and screen activity show which tools help and which ones create friction, especially with clear visualization. This helps you reduce tool overload and remove low-value steps.
Attendance and workload signals for better capacity planning
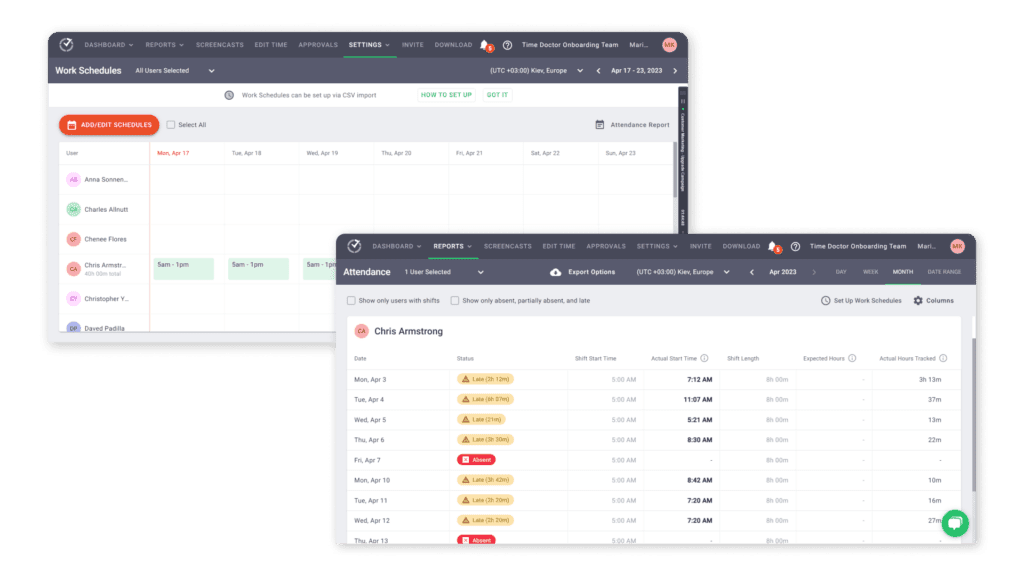
Tracking workload and attendance helps you collect data on capacity so you can prevent overload and keep processes running well.
Unusual Activity Report for early risk detection
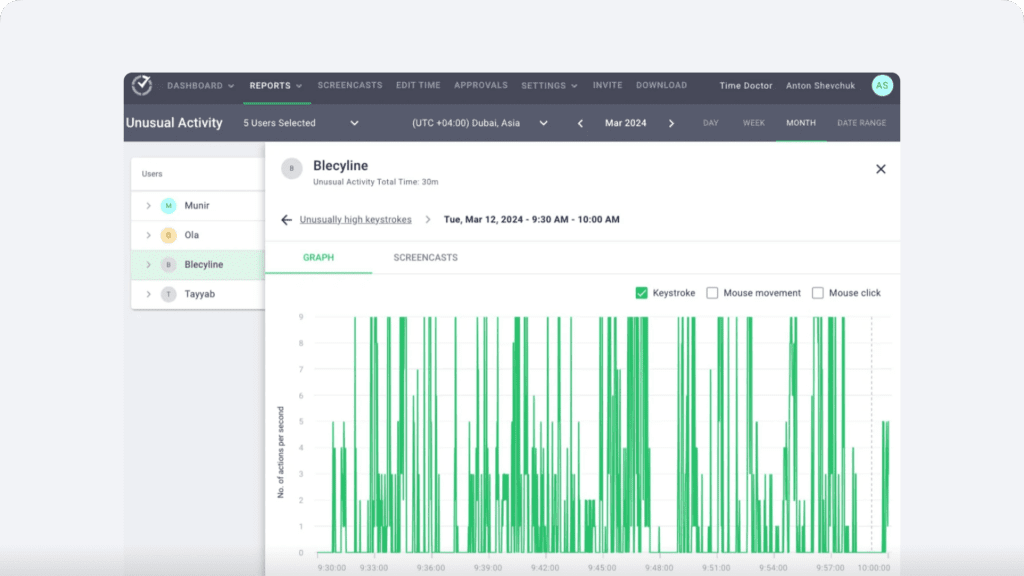
Time Doctor flags workflow shifts early, such as drops in activity, inconsistent execution, or unusual task switching, so you can fix issues before they affect performance.
Workforce Analytics for consistent team performance
Standardized metrics help you compare performance fairly across your workforce, making it easier to stay consistent and improve execution. Time Doctor gives you the clarity to optimize workflows, reduce waste, and lead with trust and transparency.
Final thought
Data-driven process optimization gives you the clarity to improve how work gets done in any work setting. With real-time Workforce Analytics, you can clearly see where time is spent, where workflows slow down, and where better decisions can move your operation forward.
Time Doctor gives you the insights you need to reduce friction, plan smarter, and make your processes more consistent.
With full visibility into how your team works, what hidden inefficiencies would you fix first?
Get a demo to improve data-driven process optimization.
Frequently asked questions (FAQs)
Data-driven optimization uses real-time data to fix workflow delays and improve efficiency. Time Doctor strengthens this by giving you accurate visibility into how work happens so you can identify issues quickly and make smarter improvements.
Data-driven processes rely on clear signals like cycle time, task duration, workload balance, and application usage to guide decisions instead of assumptions. Time Doctor gives you these insights in real time so you can understand what’s happening and act with confidence.
The purpose of process optimization is to reduce waste, remove workflow friction, and improve performance using accurate data. Time Doctor provides real-time visibility into how work gets done, so you can streamline processes with confidence.
Data-driven prioritization helps you rank work by real impact, so teams focus on what matters most. Time Doctor supports this by providing real-time insights and trend data that clarify and simplify prioritization.
Time Doctor gives you clear before-and-after visibility into workflow changes. You can track task time, productivity, and activity patterns to see if your optimization efforts reduced waste or improved cycle time. This makes it easier to measure ROI without guessing.
Yes. Software usage and screen monitoring show how often tools are used and whether they support productive work, helping you spot early future trends in tool performance. This makes it easier to evaluate licenses, remove clutter, and cut spending on tools that no longer add value.
Time Doctor provides neutral insights into how work happens, not personal screenshots. Data science helps reveal patterns so you can coach on workflows, focus time, and handoffs with trust.
Yes. Patterns in workload balance, attendance, capacity signals, and task timelines give you a data-based view of how much work teams can realistically absorb. This helps you plan staffing, avoid overload, and improve resource allocation for upcoming initiatives.


Liam Martin is a serial entrepreneur, co-founder of Time Doctor, Staff.com, and the Running Remote Conference, and author of the Wall Street Journal bestseller, “Running Remote.” He advocates for remote work and helps businesses optimize their remote teams.