Quick overview
The 7 most common operational inefficiencies are:
- Poor visibility into time use
- Workflow and approval delays
- Manual, siloed reporting
- Tool sprawl and SaaS waste
- Misaligned performance metrics
- Reactive capacity planning
- Low-value activity patterns
In this article, you’ll learn how to identify and correct these inefficiencies using structured, scalable workforce analytics that turn visibility into action.
If your team works hard but your business performance remains inconsistent, what is slowing you down?
Workflow bottlenecks return. Decisions slow down. Your team puts in the effort, yet the gains feel smaller than expected. These operational inefficiencies quietly chip away at your bottom line and block meaningful cost savings.
Across industries, the cost of lost productivity is massive. According to Gallup’s State of the Global Workplace Report, “global employee engagement sits at just 23%, and disengagement costs the global economy an estimated $8.8 trillion annually”.
When effort does not translate into results, operational performance suffers — even when your team works hard.
Table of Contents
- What is the meaning of operational inefficiencies?
- Reactive operations vs structured operations: What’s the difference?
- 7 common operational inefficiencies slowing business performance
- How modern operations teams prevent operational inefficiencies from escalating
- Workforce analytics as the foundation for operational efficiency
- Time Doctor: A workforce analytics to fix operational inefficiencies
- Final thoughts
- Frequently asked questions (FAQs)
What is the meaning of operational inefficiencies?
Operational inefficiencies happen when your business operations use more time, labor, or tools than necessary to meet your business needs. Instead of turning effort into results, delays and duplication consume valuable time.
You rarely see one major breakdown. Instead, inefficiencies show up in day-to-day work. Tasks take longer. Approvals pile up. Reports slow decisions. Output doesn’t match the effort.
To fix this, you need clear visibility into where friction lives. You need to see how time, workflows, and resources interact so you can streamline processes without adding new complexity.
3 types of operational inefficiency
Operational inefficiencies typically fall into three categories.
1. Structural inefficiencies
These inefficiencies come from poor process design. Too many approvals and unclear handoffs create bottlenecks. In manufacturing, inventory management, or healthcare providers, weak processes delay work and put pressure on capacity.
2. Resource inefficiencies
These occur when time, tools, or talent are misaligned. Resource allocation shifts reactively. Some teams absorb excess workload while others remain underutilized. Redundant tools increase cost without improving productivity. Effort spreads thin across the system.
3. Behavioral inefficiencies
These appear in daily activity patterns. Excessive meetings, constant context switching, unclear performance metrics, and limited employee training reduce focus. Low-value and repetitive tasks consume attention. Wasted effort accumulates even when employees stay engaged.
By contrast, operational efficiency means your business processes translate time and resources directly into measurable results.
Performance metrics with clarity and reflect real output. Teams focus on high-impact work instead of fixing inefficient processes.
When inefficiencies go unchecked, operational costs rise, margins tighten, and delays begin to affect delivery and customer satisfaction.
Once you see where inefficiency hides, you can stop compensating for it and start correcting it.
The next question becomes simple:
Are your operations reacting to problems, or preventing them?
The difference shows up in how visibility, decision-making, and resource allocation are handled day-to-day.
Reactive operations vs structured operations: What’s the difference?
| Area | Reactive Operations | Structured Operations |
| Visibility | Rely on assumptions and delayed reports | Real-time visibility into time, workflows, and performance |
| Workflow | Bottlenecks discovered after deadlines slip | Bottlenecks identified early through pattern analysis |
| Reporting | Spreadsheet-heavy and fragmented | Centralized, automated reporting |
| Metrics | Activity-focused KPIs | Outcome-aligned performance metrics |
| Capacity Planning | Adjust after the overload happens | Balance workload proactively |
| Tool Usage | Redundant apps and SaaS sprawl | Data-driven tool consolidation |
| Decision-Making | Reactive fixes | Data-driven continuous improvement |
7 common operational inefficiencies slowing business performance
1. Lack of visibility into how time is spent
When you lack visibility into how time is spent, operational decisions rely on assumptions. Teams stay busy, yet you struggle to explain where effort actually goes. Productivity conversations become subjective. Resource allocation feels uneven. Planning depends on estimates instead of verified data.
Over time, this creates blind spots in operational performance and weakens continuous improvement efforts.
Signals:
- Inconsistent reporting across departments
- Disagreements about workload fairness
- Performance metrics that track activity but not outcomes
- Difficulty connecting time spent to measurable results
- Frequent surprises in delivery timelines
How to fix it?
Start by connecting time to outcomes.
Modern teams use workforce analytics to create structured visibility into how work actually happens. Instead of relying on fragmented spreadsheets or manual reporting, they centralize time data and analyze workflow patterns in real time.
This allows you to:
- Identify where time supports high-impact work
- Detect wasted effort before it compounds
- Align performance metrics with business goals
- Replace assumption-based planning with data-driven decisions
When you can clearly see how effort translates into results, operational inefficiencies become measurable and easier to address.
2. Workflow bottlenecks and approval delays
Workflow bottlenecks occur when work consistently slows at the same points in a process.
Approval layers stack up, creating time-consuming delays. Decision-making concentrates around one overloaded role. Handoffs lack clarity. Instead of flowing forward, tasks wait.
Over time, small delays compound and extend delivery cycles, reduce operational performance, increase coordination costs, and create friction in the customer experience.
Signals:
- Repeated slowdowns at specific approval stages
- Overloaded managers or decision-makers
- Tasks sitting idle between handoffs
- Escalations caused by unclear ownership
How to fix it
Identify recurring constraints.
Use workforce analytics to see where work slows down and where tasks pile up. Clear visibility into timeline data and workload distribution helps you spot structural friction in your business processes instead of guessing.
With that insight, you can redesign approvals, rebalance decision authority, remove unnecessary steps, and streamline operations. Bottlenecks become measurable and easier to fix.
3. Manual reporting and data silos
Manual reporting creates a delay between activity and insight. Teams rely on spreadsheets. Data lives in separate tools such as spreadsheets, project management systems, CRM platforms, and even disconnected onboarding systems. By the time reports reach leadership, the moment for proactive action has passed.
This slows data-driven decisions and weakens continuous improvement.
Signals:
- Heavy spreadsheet dependency
- Lagging performance insight
- Inconsistent reporting formats
- Multiple sources of “truth”
How to fix it
Shift from manual aggregation to centralized visibility.
You consolidate time, activity, and workflow data into one clear reporting structure. Automated reporting replaces fragmented updates and reduces repetitive data entry errors. Instead of looking backward, you gain real-time insight to guide faster decisions.
When reporting becomes structured and consistent, you reduce delays and strengthen operational clarity.
4. Tool overload and shadow IT
As teams grow, they adopt new tools to solve immediate gaps. Over time, redundant SaaS platforms accumulate. Employees switch between apps constantly. Costs increase, but productivity does not improve.
This creates resource inefficiency and weakens cost control.
Signals:
- Multiple tools serving similar functions
- High app-switching behavior
- Rising software costs without performance gains
- Limited visibility into actual tool usage
How to fix it
Begin with app usage visibility.
Understand how tools are actually used and audit digital workflows by using workforce analytics. By reviewing application patterns and time allocation, you identify redundant and underutilized platforms with clarity instead of assumptions.
Consolidating tools based on real usage data improves productivity and helps you lower costs without disrupting workflows.
5. Misaligned performance metrics
When performance metrics focus on activity instead of outcomes, teams optimize for visibility rather than value. You may track hours or task volume, yet struggle to connect effort to business goals.
This creates confusion and weakens accountability.
Signals:
- High activity levels but unclear impact
- KPIs (Key Performance Indicators) that vary widely across teams
- Difficulty linking time spent to results
- Performance conversations based on perception
How to fix it
Align metrics to outcomes.
You can use productivity analytics to connect time, output, and workflow performance. By benchmarking patterns across roles and teams, you can identify what drives measurable results.
When performance metrics reflect impact instead of activity alone, accountability becomes clearer and more consistent.
6. Reactive capacity planning
Reactive capacity planning forces teams into firefighting mode. In real-world environments, workloads spike unexpectedly and overtime rises. Some teams burn out while others remain underutilized.
Without visibility into workload distribution, you adjust after pressure builds.
Signals:
- Frequent overtime spikes
- Sudden deadline compression
- Supply chain disruptions
- Uneven workload across departments
- Burnout risk rising in specific teams
How to fix it
Monitor workload distribution proactively.
Track workload patterns in real time to catch imbalance early. Workforce analytics highlights underutilization and overload before operational performance starts to decline.
When you see capacity trends clearly, you can rebalance assignments, protect team health, and stabilize operational performance.
7. Low-value or idle activity patterns
Not all busy work drives results. Excessive meeting time, context switching, and distraction patterns reduce focus and quietly affect employee well-being. Teams stay active but produce less high-impact work.
Over time, these behavioral inefficiencies lower productivity and distort performance data.
Signals:
- Excessive meeting load
- High idle time during core hours
- Frequent task switching
- Activity concentrated in low-impact tools
How to fix it
Review activity patterns with discipline.
Analyze productivity patterns to spot low-value work. By reviewing time allocation, idle trends, and workflow concentration, you guide your team toward higher-impact focus and stronger operational performance.
Clear visibility into daily activity supports better time management and reduces wasted effort without micromanagement.
How modern operations teams prevent operational inefficiencies from escalating
High-performing operations teams do not rely on reactive fixes. They use structured visibility and process optimization to reduce inefficiencies before performance declines.
Step 1: Connect time to results
Connect time spent to measurable business outcomes. If effort does not clearly support operational performance or cost reduction goals, inefficiencies remain hidden.
When you align productivity data with outcomes, you reduce assumption-based planning and strengthen data-driven decisions.
Step 2: Make workflow bottlenecks visible
Monitor workflow patterns, approval delays, and handoff gaps. Instead of reacting after delivery slows, you identify structural inefficiencies early.
Clear workflow visibility improves process optimization and protects operational performance.
Step 3: Use consistent performance metrics
Ensure performance metrics reflect outcomes, not just activity. When you benchmark productivity patterns consistently, you detect imbalance, underutilization, and emerging inefficiencies across teams.
Standardized metrics support continuous improvement and fair accountability.
Step 4: Identify recurring waste early
Review activity patterns to identify excessive meetings, idle time, duplicated reporting, and tool overload. Recurring waste signals deeper operational inefficiencies.
Early detection stabilizes capacity planning and reduces burnout risk.
Step 5: Centralize visibility across teams
Consolidate time data, workflow reporting, and productivity analytics into one consistent structure. Centralized visibility removes blind spots and reduces fragmented reporting.
When visibility remains consistent across remote, hybrid, and in-office teams, you improve operational efficiency without micromanagement.
Workforce analytics as the foundation for operational efficiency
Workforce analytics gives you a clear operational baseline. For many operations leaders, that level of structured visibility becomes a true game changer in stabilizing performance.
Instead of relying on delayed summaries or fragmented updates, you gain measurable clarity into how productivity, resource allocation, and workflow execution align with business outcomes.
This strengthens how you lead. You replace assumptions with data. You coach teams based on measurable patterns. You create accountability without control-based management.
Operational inefficiencies stop hiding inside disconnected systems.
But visibility alone is not enough.
You need a workforce analytics platform that turns data into structured, actionable insight — whether you lead a small business or a distributed enterprise team. You need consistent reporting across remote, hybrid, and in-office teams. You need clarity that supports operational performance without increasing IT burden or adding complexity for your managers.
So which workforce analytics platform gives you real-time awareness, practical insight, and easy adoption at scale?
This is where Time Doctor supports your operational strategy.
Time Doctor: A workforce analytics to fix operational inefficiencies
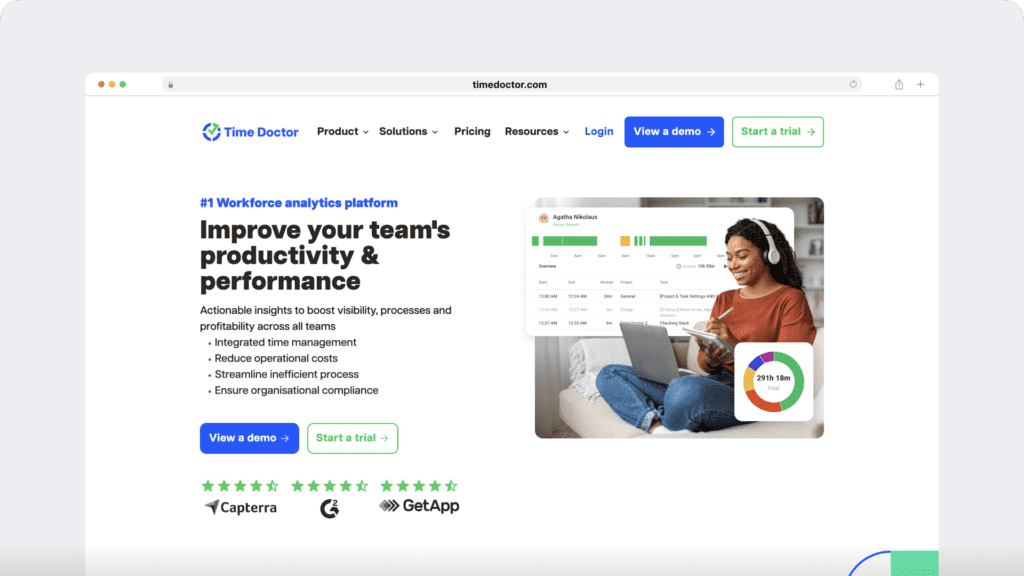
Time Doctor helps you identify and eliminate operational inefficiencies across your business processes. Instead of reacting to workflow bottlenecks, misaligned performance metrics, or capacity planning gaps, you gain clear, measurable insight into how work actually happens.
With that visibility in place, you can take action. Here are the Time Doctor features that help you eliminate operational inefficiencies at scale:
- Use Employee Time Tracking to expose where time fails to translate into results, reduce wasted effort, and strengthen operational efficiency.
- Apply Productivity Analytics and Benchmarks AI, powered by artificial intelligence, to detect performance gaps, workload imbalance, and underutilization before they impact operational performance.
- Leverage Employee Monitoring and Screen Monitoring to identify workflow friction, distraction patterns, and low-value activity without relying on assumptions.
- Use Meeting Insight to uncover excessive meeting load that slows execution and reduces productivity across business processes.
- Monitor workload distribution across your Distributed Workforce to prevent reactive capacity planning and stabilize resource allocation in remote, hybrid, and in-office teams.
- Detect recurring inefficiencies early with the Unusual Activity Report, so idle time and performance drift do not compound over time.
- Review Software Cost Insight and application usage data to eliminate redundant tools, control SaaS expenses, and reduce operational waste.
- Align verified time data with Attendance and Payroll records to remove reporting inconsistencies and improve accountability across teams.
- Connect your systems through secure Integrations to eliminate data silos and maintain consistent operational reporting without increasing IT burden.
- Strengthen daily execution with built-in Time Management visibility that keeps teams focused on high-impact work and reduces behavioral inefficiencies.
You gain actionable visibility that improves operational performance without adding complexity. Measurable insight replaces assumptions, and accountability strengthens without control-based management.
Final thoughts
Operational inefficiencies rarely announce themselves. They build quietly inside everyday business processes. A delayed approval. A reporting gap. A workload imbalance. Over time, those small gaps reduce operational performance, increase costs, and make growth feel heavier than it should.
When results fall short, it’s easy to question effort. But operational inefficiencies often resemble friction in an engine. The team keeps moving, the work keeps turning, yet hidden resistance slows momentum.
Clear visibility changes that.
When you understand how time, workflows, productivity, and resource allocation connect to business outcomes, reactive management shifts into proactive leadership. Decisions rely on measurable insight. Accountability strengthens through transparency. Continuous improvement becomes structured instead of occasional.
That is where Time Doctor helps. It brings workforce analytics, productivity insight, and operational clarity into one platform so inefficiencies become visible before they escalate.
Operational efficiency does not depend on working harder. It depends on seeing clearly.
View a demo to reduce operational inefficiencies before they impact performance.
Frequently asked questions (FAQs)
Operational efficiency is the ability of a business to convert time, people, and resources into measurable results with minimal waste.
Operational efficiency improves when leaders use workforce analytics to align effort with outcomes and continuously refine business processes. Time Doctor is a workforce analytics platform that provides real-time productivity insights, Benchmarks AI comparisons, and structured reporting, helping you identify workflow bottlenecks, workload imbalance, and recurring waste early.
You fix operational inefficiencies by identifying where time, resources, and workflows fall out of alignment with business outcomes. Effective strategies include:
• Making time and workflow data visible in real time
• Detecting recurring bottlenecks and approval delays
• Aligning performance metrics with measurable results
• Standardizing reporting across teams
• Surfacing recurring waste early
Time Doctor supports this as a workforce analytics platform that centralizes visibility into productivity, workflow patterns, and resource allocation. With features such as Productivity Analytics, Benchmarks AI, structured reporting, and real-time activity insights, it helps you identify bottlenecks, workload imbalance, and duplicated effort so you can correct inefficiencies before they affect operational performance or margins.
Automation improves operational efficiency by reducing manual reporting, standardizing data collection, and accelerating visibility into workflow performance. It removes delays caused by spreadsheet dependency and fragmented systems.
Time Doctor supports this as a workforce analytics platform that automates time capture, activity reporting, and productivity insights. Features such as Productivity Analytics and Benchmarks AI surface workflow bottlenecks, workload imbalance, and recurring waste early, helping leaders address operational inefficiencies before they escalate.
Operational efficiency means work flows smoothly and effort translates directly into results. For example:
• Tasks move between stages without workflow bottlenecks
• Performance metrics reflect real business outcomes
• Resource allocation aligns with workload demand
• Reporting supports fast, data-driven decisions
When these elements align, operational performance improves without increasing pressure on teams.
Operational inefficiencies reduce profitability by increasing labor costs, extending delivery timelines, and distorting capacity planning. Small workflow bottlenecks, reporting delays, and duplicated work compound over time. Even high-performing teams struggle when inefficiencies quietly erode margins, increase turnover risk, and weaken retention.
Workforce analytics uses real-time time tracking, productivity data, and workflow insights to show how work actually happens. It helps you identify bottlenecks, workload imbalance, and wasted effort before they impact operational performance.
Time Doctor is a workforce analytics platform that gives you clear, AI-enhanced visibility into how work gets done. With structured reporting and consistent metrics across remote, hybrid, and in-office teams, it helps you correct operational inefficiencies early and lead with trust, not control.
AI improves operational efficiency by analyzing productivity patterns and detecting inefficiencies early. AI-powered tools can:
• Benchmark performance across teams
• Identify underutilization or workload imbalance
• Detect recurring workflow bottlenecks
• Surface emerging performance risks
Time Doctor use Benchmarks AI and Productivity Analytics to turn operational data into actionable insight that supports proactive leadership.
Several tools help identify workflow bottlenecks and operational inefficiencies, including:
• Workforce analytics platforms
• Productivity analytics dashboards
• Workflow and timeline reporting tools
• Structured activity and performance reporting systems
Time Doctor is a workforce analytics platform that brings these capabilities together in one structured system. By centralizing time data, workflow visibility, and AI-enhanced insights, it helps you pinpoint delays, workload imbalance, and recurring process friction so you can address bottlenecks with clarity and confidence.
Operational inefficiencies in healthcare can lead to staffing strain, delayed patient services, rising operational costs, and increased burnout. Structured workforce analytics of Time Doctor helps healthcare leaders stabilize workload distribution, streamline reporting, and improve operational visibility without adding administrative burden.


Carlo Borja is the Content Marketing Manager of Time Doctor, a workforce analytics software for distributed teams. He is a remote work advocate, a father and an avid coffee drinker.