Quick overview
Customer profitability drops when the work required to serve customers increases without clear visibility. Teams may hit SLAs, but hidden effort, rework, and inefficiencies quietly reduce margins.
This guide shows how operations leaders use workforce analytics to support customer profitability analysis, uncover hidden effort, improve workflows, and protect margins.
How can customer profitability slip when everything seems to be working fine?
You may be hitting SLAs. Your customers are satisfied. Your team is busy.
But still, margins and overall profitability keep shrinking.
It feels like running on a treadmill. The effort increases, but you are not moving forward.
Some customers take more time, follow-ups, and fixes than others. Work builds up in ways that are hard to see, and while your team stays busy, much of that effort does not create real value or strengthen the customer relationship.
When there is no clear visibility, inefficiencies and over-servicing start to build up. Over time, this results in low profitability.
Table of Contents
- Why does customer profitability matter?
- What is customer profitability?
- Benefits of customer profitability analysis
- What factors influence customer profitability?
- How do you measure customer profitability effectively?
- How to improve customer profitability with better operational visibility
- When should you act on customer profitability?
- When should you phase out non-profitable customers?
- Why is it hard to see true customer profitability?
- How workforce analytics helps improve customer profitability
- Turn customer profitability analysis into measurable action with Time Doctor
- Final thoughts
- Frequently asked questions (FAQs)
Why does customer profitability matter?
Customer profitability matters because revenue alone does not show whether your business is actually making money. Without understanding cost to serve, you risk scaling work that looks successful on the surface but quietly reduces your margins.
What is customer profitability?
Customer profitability is the net profit earned from a customer after subtracting all costs required to serve them, including time, support, and operational effort. This includes acquisition costs, plus the time, support, and effort your team spends delivering the service.
Think of it like running a food delivery service. Two customers ordered the same meal at the same price. However, one is nearby and easy to serve, while the other requires longer travel, multiple calls, and special requests.
Even if they pay the same, one leaves you with more profit because they require less effort.
This means looking beyond revenue and focusing on the metrics that show how much time and effort each customer requires. Two customers may pay the same, but if one takes more hours or support, they generate less net profit.
Understanding customer profitability helps you see where your team’s effort is too high, where costs are building up, and where your margins are being reduced without you noticing. This is where total revenue alone can be misleading.
Customer profitability vs total revenue: what’s the difference
Revenue shows how much a customer pays. Customer profitability shows how much value your business actually keeps after delivering the work. A high-revenue customer is not always a high-profit customer.
In many operations environments, some accounts generate strong revenue but require excessive support, frequent escalations, or repeated rework.
Over time, the cost of serving these customers reduces their contribution to overall profit.
Revenue vs customer profitability at a glance
| Aspect | Revenue | Customer Profitability |
| What it shows | Total amount a customer pays | Net profit after all costs to serve |
| Focus | Income generated | Value retained after delivery |
| Includes costs? | No | Yes, including time, support, and rework |
| Visibility into effort | None | High visibility into effort and resources used |
| Risk | Can overestimate value | Shows true contribution to profit |
When you look beyond revenue and focus on profitability, you get a clearer picture of which customers truly support your margins and which ones are quietly increasing your costs.
This is where Customer Profitability Analysis (CPA) comes in.
Customer Profitability Analysis (CPA) is the process of evaluating how much profit each customer generates after accounting for the total cost to serve them.
Benefits of customer profitability analysis
Customer profitability analysis helps you move beyond revenue and understand how effort impacts margins across your customer base.
It allows you to:
- Identify which customers generate the most profit
- Spot high-effort, low-margin accounts
- Reduce cost to serve by improving workflows
- Allocate resources more effectively across teams
- Make better decisions on pricing, retention, and service levels
Instead of focusing only on revenue, CPA connects financial outcomes with operational effort. It helps you understand how time, support, and workflows impact customer-level margins.
What factors influence customer profitability?
Customer profitability is influenced by both financial inputs and operational effort. For operations leaders, the real impact comes from how time, resources, and workflows are used to serve each customer.
1. Customer Acquisition Cost (CAC)
Customer acquisition cost includes the time, effort, and resources spent to win a new customer. When CAC is high, it takes longer to recover that investment, especially if ongoing service delivery also requires significant operational effort.
2. Revenue drivers (Volume and frequency)
Customers who generate frequent or high-value transactions can improve profitability. However, this only holds if the operational effort required to support them stays efficient. High revenue with high effort can still result in low margins.
3. Cost to serve
This is the most critical factor for operations teams. It includes the time spent on delivery, support, coordination, and issue resolution. When customers require excessive time or repeated work, the cost to serve increases and reduces profitability.
4. Pricing strategies
Pricing determines how much margin is available from each customer. However, if pricing does not reflect the actual effort required to deliver the service, even well-priced contracts can become unprofitable over time.
5. Customer loyalty and retention
Long-term customers often bring stable revenue and lower acquisition costs. But from an operations perspective, their profitability still depends on how efficiently they are supported over time.
6. Payment behavior
Delayed payments or frequent follow-ups increase administrative workload. This adds hidden operational costs that reduce the overall net profit from those customers.

How do you measure customer profitability effectively?
To measure customer profitability effectively, you need to connect revenue with the actual work required to support each customer. This means tracking not just financial data, but also real-time time, effort, and operational activity across teams.
Let’s say two customers both generate $2,000 in monthly revenue.
At first glance, they appear equally valuable. However, the effort required to support each one tells a different story.
Step 1: Calculate cost to serve
Formula:
Cost to Serve = Time Spent × Cost per Hour
Customer A
- Time spent: 20 hours
- Cost per hour: $35
Cost to serve:
20 × $35 = $700
Customer B
- Time spent: 50 hours
- Cost per hour: $35
Cost to serve:
50 × $35 = $1,750
Step 2: Calculate profit
Formula:
Profit = Revenue − Cost to Serve
Customer A
$2,000 − $700 = $1,300 profit
Customer B
$2,000 − $1,750 = $250 profit
Even though both customers generate the same revenue, Customer B is far less profitable because it requires significantly more time, support, and coordination.
This reflects the 80/20 rule for customer profitability, where a small group of customers drives most of your profit, while others consume more resources than they generate.
This is why profitability depends on how much effort your team actually spends delivering the work.
Key metrics to monitor
1. Customer Profitability Score (CPS)
Measure profitability using a simple formula:
CPS = Revenue − Total Cost to Serve
This gives you a direct view of net profit per customer.
2. Net Revenue per Customer
Track revenue after accounting for discounts, refunds, or adjustments. This shows the actual value each customer brings in before operational costs are applied.
3. Customer Concentration Ratio
Compare high-effort, low-margin customers against low-effort, high-margin ones. This helps you see whether your team’s workload is aligned with your most profitable customers.
Key steps to measure customer profitability
1. Identify revenue & costs
Start by calculating total revenue per customer, including any discounts or adjustments. Then map out all associated costs, especially the time and effort your team spends on delivery, support, escalations, and coordination. This means going beyond financial data and tracking how much time and effort your team spends on each customer.
2. Allocate costs accurately
Not all costs are direct. You also need to account for shared resources like support teams, management oversight, and internal processes. Allocating these based on actual usage helps you understand how much effort each customer truly consumes. This requires visibility into how shared resources and team time are actually used across customers.
3. Calculate individual P&L
Create a simple profit and loss view for each customer or segment by comparing their revenue against the total cost to serve. This makes it easier to identify which customers contribute to profit and which ones are draining resources.
4. Analyze key metrics
Use operational and financial metrics together to evaluate profitability. Look at patterns in time spent, workload, and service demand alongside revenue. This helps you understand long-term profitability, not just short-term gains. To do this effectively, you need clear visibility into time, workload, and operational activity across customers.
How to improve customer profitability with better operational visibility
Improving customer profitability starts with optimization as part of your overall business strategy. Focus on reducing unnecessary effort, aligning resources with the right customers, and turning revenue into sustainable profit.
1. Segment customers based on value and effort
Go beyond basic segmentation and group customers based on profitability and cost to serve
- Identify high-value customer segments that generate strong returns with lower effort
- Compare them with customer groups that require more time, support, or customization
- Prioritize where to invest resources based on the value and effort of each segment and group
- Optimize service for customer segments that consume more resources than they return
2. Optimize pricing strategies
Ensure pricing reflects the actual effort required to serve each customer
- Calculate customer profitability first to understand how revenue compares to cost to serve
- Avoid pricing high-touch customers the same as low-effort ones, as this reduces margins over time
- Adjust pricing based on service complexity, support needs, and delivery effort
- Keep pricing aligned with workload to maintain profitability
3. Reduce over-servicing and unnecessary work
Over-servicing is a major driver of hidden cost, as frequent follow-ups, custom requests, and repeated issue resolution increase time spent without adding value
- Use forecasting to anticipate service demand and prevent excessive effort before it builds up
- Set clear service boundaries to control workload, reduce unnecessary effort, and protect margins
4. Fix workflow bottlenecks and inefficiencies
Workflow inefficiencies increase delivery time and create unnecessary cost across each individual customer
- Identify where delays, rework, and poor handoffs occur across each individual customer workflow
- Analyze how time is spent per individual customer to spot inefficiencies and unnecessary effort
- Streamline handoffs and remove redundant steps to reduce delivery time and cost to serve
- Standardize workflows to improve turnaround time and support overall optimization
5. Improve resource allocation across teams
Not all customers need the same level of support
- Make a strategic decision to standardize business processes and create clear, repeatable workflows
- Document and align tasks across teams to reduce errors and rework
- Improve efficiency and lower operational and marketing costs over time through consistency
6. Standardize processes and reduce rework
A structured approach to handling tasks consistently to minimize errors, rework, and wasted effort.
- Make a strategic decision to apply business process standardization across teams
- Document clear steps for common tasks to ensure consistency
- Align teams on how work should be handled to reduce errors and rework
- Identify and eliminate repeated tasks that do not add value
- Use standardized workflows to improve efficiency and reduce operational and marketing costs over time
7. Automate customer processes
The use of tools and systems to handle repetitive tasks so teams spend less time on manual work.
- Identify repetitive tasks like onboarding, follow-ups, and support requests
- Use automation tools to handle routine workflows and reduce manual effort
- Set up self-service options so customers can resolve simple issues on their own
- Automate handoffs and updates to improve consistency across teams
- Reduce time spent per customer to lower the cost to serve and improve efficiency
8. Focus on customer lifetime value (CLV) and retention
Customer lifetime value focuses on the total profit a customer generates over time, not just short-term revenue.
- Identify which customers generate strong long-term value and which are less profitable customers
- Prioritize retention strategies for customers who contribute the most to long-term profitability
- Reduce churn by improving service quality and consistency
- Reassess how you support less profitable customers to control the cost to serve
- Lower acquisition costs by retaining customers who already deliver consistent value
9. Eliminate low-value activities
Low-value activities are tasks that consume time and effort without improving customer outcomes or profitability.
- Identify tasks that do not contribute to customer value or business results
- Analyze where time is spent, but does not impact profitability
- Remove unnecessary steps that create extra work without a clear benefit
- Simplify or automate repetitive low-impact tasks
- Redirect time and resources toward higher-value work that improves profitability
When should you act on customer profitability?
You should take action when:
- Cost to serve keeps increasing without revenue growth
- Certain customers require significantly more time than others
- Your team is busy, but margins continue to shrink
- High-revenue customers consistently demand more support
These are clear signs that effort is not aligned with value and that profitability needs to be optimized.
At this stage, the goal is to optimize and fix the problem. But if these issues continue even after improvements, the next step is to reassess whether the customer relationship still makes sense.
When should you phase out non-profitable customers?
Not every customer will be worth keeping, especially when profitability does not improve after optimization.
If unprofitable customers keep demanding more time, support, and rework than the value they bring, even after fixes, it’s time to rethink the relationship.
This often comes down to customer behavior. Some customers naturally require more effort, which quietly affects your team’s capacity, your marketing strategies, and your overall results.
The hard part is seeing it clearly. Without the right data, your decision-making can rely on assumptions instead of what’s actually happening.
When the effort stays high and nothing improves, letting go becomes a smart decision. It frees up your team to focus on customers that truly drive growth.
Workforce analytics gives you that clarity by showing how time, effort, and customer behavior impact your business in real terms.
Why is it hard to see true customer profitability?
You can’t improve customer profitability if you don’t know how much work each customer type actually consumes.
Most teams have data, but it’s disconnected. Revenue often sits in your CRM, while time, effort, and daily work sit somewhere else.
Because of this, hidden work builds up. Rework, follow-ups, and constant support quietly increase the cost to serve, even when everything looks fine on the surface.
This makes some types of customers appear profitable when, in reality, they are draining your team’s time and resources.
As noted in a Forbes Business Council article, “sustainable profits are based on lifetime customer value.” This reinforces why understanding the true effort behind each customer is critical to long-term profitability.
Without clear visibility into time and effort, decision-making becomes guesswork.
This is where workforce analytics becomes critical. It helps you link customer value with the actual effort behind it, so you can see what is truly driving profitability.
How workforce analytics helps improve customer profitability
Improving customer profitability is not just about reducing costs or increasing revenue. It’s about understanding how work actually happens across different types of customers.
When you can see how time, effort, and workflows connect to each customer, you can make better decisions about where to optimize, where to adjust, and where to invest.
Track time per customer
You need to see how much time your team spends on each customer across projects, tasks, and workflows.
With workforce analytics, you can track time by client, project, and task, making it easier to compare effort across customer types and quickly spot those that require more support than expected.
Identify hidden inefficiencies
Not all work shows up in reports. Small delays, task switching, and time spent on tools like social media can quietly increase your cost to serve.
In supply chain environments, this often shows up as extra time spent on coordination, logistics, and issue handling across multiple touchpoints.
With clear visibility into app usage and workflows, you can quickly spot where time is going and reduce the work that hurts profitability.
Balance workload across customers
Some customers naturally demand more attention, which can create imbalance across your team.
With workforce analytics, you can see patterns in time and effort, rebalance workloads, reduce over-servicing, and align your team’s support with the right customers.
Simplify compliance reporting
In regulated environments like BPO, healthcare, or finance, you need visibility that also supports compliance.
With Time Doctor, you get audit-ready data like activity tracking and optional screenshots, so you can stay transparent and meet reporting requirements without adding extra manual work.
Prevent burnout
When certain customers require too much time and effort, your team feels it first.
By tracking workload patterns and time allocation, you can spot overload early, protect work-life balance, and maintain steady performance across your team.
This is where a workforce analytics platform like Time Doctor comes in. Instead of guessing which customers are profitable, you can see it clearly and act on it.
Turn customer profitability analysis into measurable action with Time Doctor
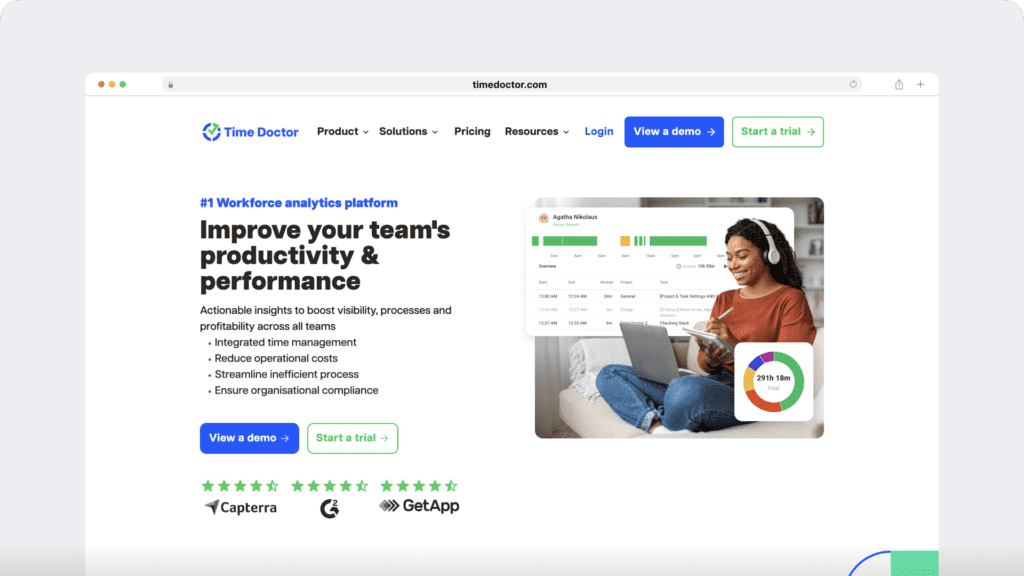
Time Doctor is a workforce analytics platform that empowers you to connect how work happens to how profitable your customers actually are.
By transforming time, activity, and workflow data into AI-enhanced, actionable insights, you can clearly see how much effort each customer requires, identify inefficiencies, and allocate resources more effectively across your teams.
This gives you the clarity to make faster, smarter decisions, reduce over-servicing, control cost-to-serve, and improve margins without relying on guesswork. At the same time, you maintain transparent, trust-first visibility across remote, hybrid, and in-office teams without creating a culture of micromanagement.
With Time Doctor, you can:
- Workforce Analytics connects time, activity, and workflows into clear insights, helping you make better decisions on pricing, resource allocation, and service levels
- Employee Time Tracking shows how many hours are spent per customer, team, and process, so you can understand true cost-to-serve and compare high-revenue vs high-effort account.
- Productivity Analytics uncovers inefficiencies, task switching, and low-value activities that increase operational costs and reduce customer profitability
- Benchmarks AI highlights patterns across customers and teams, helping you identify over-servicing and detect outlier accounts where effort is higher than the value they generate
- Workforce insights support compliance, reporting, and transparency without adding manual work or creating a surveillance-driven environment
- Work-life balance trends help you identify customers who drive overtime and excessive workload, so you can protect team performance and maintain sustainable operations

Final thoughts
Customer profitability becomes clear the moment you connect revenue with the real work behind it.
You either keep treating all customers the same and absorb the hidden cost, or you start seeing which ones truly create value and which ones quietly drain your team’s time and energy.
When you understand how customer behavior translates into effort, your decision-making changes. You stop guessing, start optimizing, and focus your resources on the initiatives that actually drive profit.
Bottom line, profitability improves when you see the full picture of effort, not just revenue.
That’s how you protect your team, improve profit margins, and build a more sustainable operation.
Ready to see how this works in your own team? View a demo of Time Doctor and start making smarter, data-driven decisions.
Frequently asked questions (FAQs)
Customer profitability is the net profit a business earns from a customer after subtracting all costs to serve them, including time, support, and operational effort. This often requires visibility into how work is actually done across teams.
The 80/20 rule means a small percentage of customers, often around 20%, generate most of the profit, while others contribute less or increase the cost to serve. Identifying this requires understanding how effort is distributed across customers.
Key metrics include customer lifetime value (CLV), cost to serve, revenue per customer, support time, and resource utilization. With tools like Employee Time Tracking and Productivity Analytics, you can better understand how time and effort impact these metrics.
Customer profitability is influenced by pricing, service complexity, customer behavior, support needs, and workflow efficiency. Many of these depend on how much time and effort each customer requires from your team.
A business should phase out customers when the cost to serve consistently exceeds the value they bring, even after improving pricing and processes. Clear visibility into time and effort, supported by Workforce Analytics, helps make this decision more confidently.
Businesses maximize CLV byimproving retention, reducing inefficiencies, delivering consistent value, and focusing on customers that support long-term profitability. Understanding effort patterns across customers helps guide these decisions.
Workforce analytics connects time, effort, and workflows to business outcomes, helping you identify inefficiencies, manage cost to serve, and improve customer profitability using real data. Platforms like Time Doctor combine Workforce Analytics, Benchmarks AI, and Productivity Analytics to provide this visibility and support smarter, data-driven decisions.


Carlo Borja is the Content Marketing Manager of Time Doctor, a workforce analytics software for distributed teams. He is a remote work advocate, a father and an avid coffee drinker.